Offline Retrieval Methods
Background
The Tecton SDK offers three methods for offline feature retrieval:
get_features_in_range(start_time, end_time, ...)get_features_for_events(events, ...)run_transformation(start_time, end_time, mock_inputs)
In this section, we will explore the new behavior of these methods with some examples and learn how to leverage them for training using point-in-time joins, feature data analytics, and monitoring.
The methods get_features_in_range() and get_features_for_events() support
the following values for the from_source parameter:
from_source=None(default) Feature values will be fetched from the Offline Store for Feature Views that have offline materialization enabled and otherwise compute the feature values on-the-fly from raw data.from_source=TrueUsed to bypass the offline store and compute features on-the-fly from the raw data source. This is useful for testing the expected output of feature values.from_source=FalseUsed to see materialized data in the offline store only. This forces an error if a Feature View is not yet materialized.
get_features_in_range(start_time, end_time, ...)
For
BatchFeatureView,
StreamFeatureView
and
FeatureTable.
Overview
This method retrieves feature values that are valid between the input
start_time (inclusive) and end_time (exclusive).
It returns a Dataframe containing the following:
- Entity Join Key Columns
- Feature Value Columns
- The columns
_valid_fromand_valid_to, which specify the time range for which the row of feature values is valid. The time range defined by[_valid_from, _valid_to]will never overlap with any other rows for the same join keys.
When is a feature value "valid"?
A feature value is considered to be valid at a specific point in time if the Online Store would have returned that value if queried at that moment in time.
When does a feature value change or stop being valid?
Let's take the example of an entity A that has the following transaction
events: 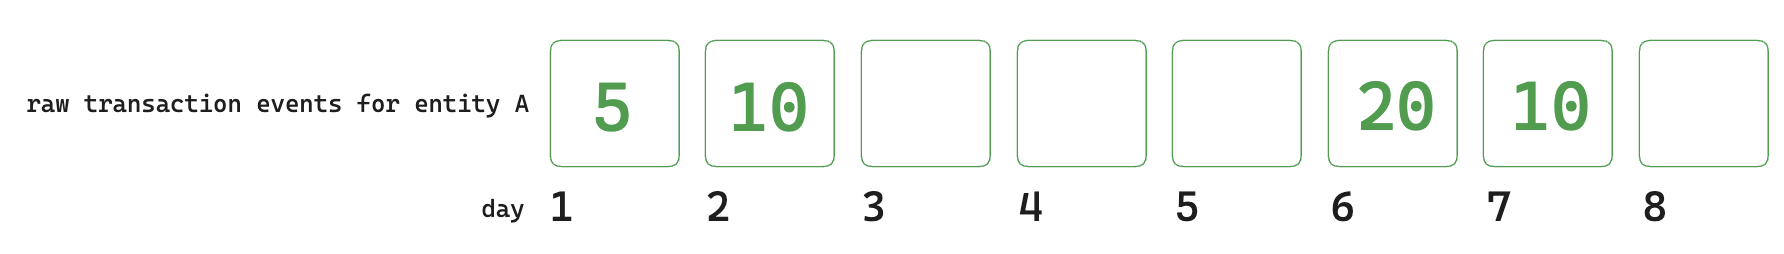
For Non-Aggregate Feature Views, the feature value will cease to be valid if:
- It is overwritten by a new event with a different value.
ttlis set and the event expires since it has been in the online store for longer thanttl.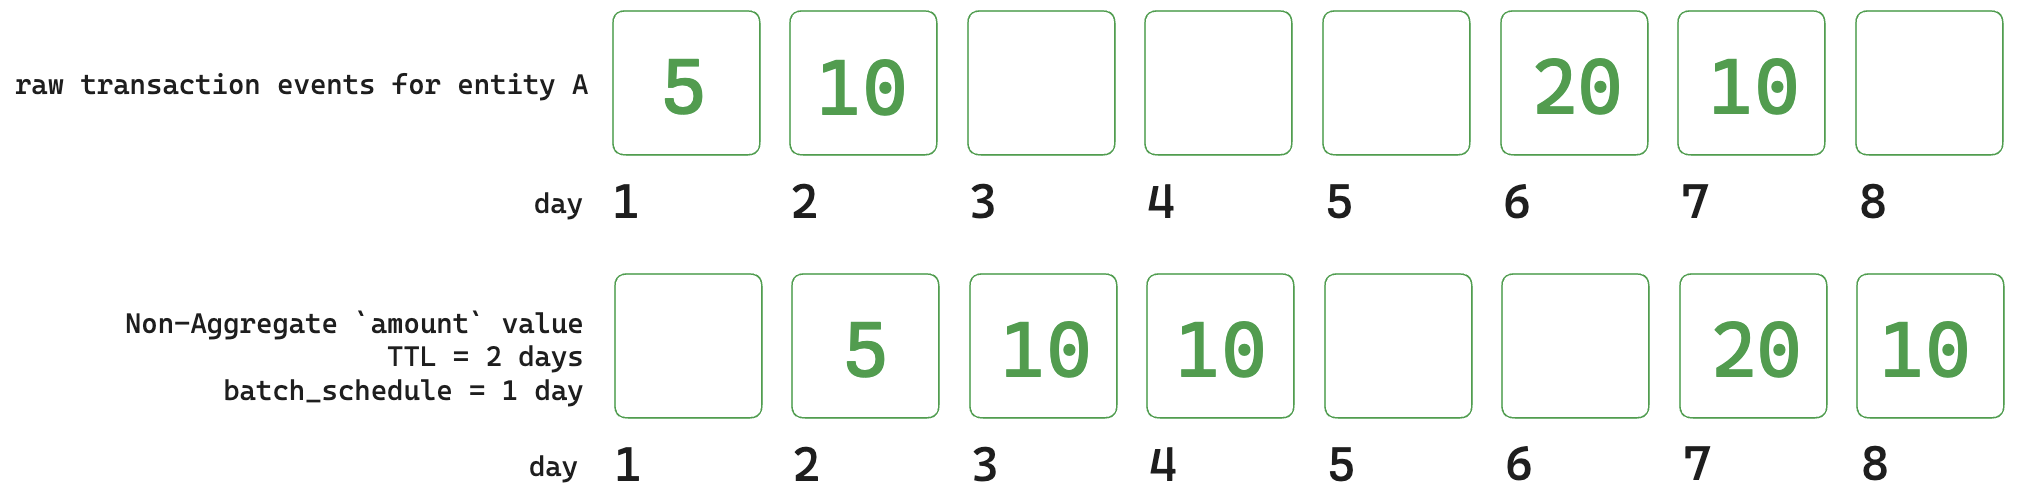
Note: If an entity has multiple events within the same batch_schedule
interval, Tecton will write the last value to the online store and this is the
value that is valid.
fv.get_features_in_range(start_time=datetime(day 1), end_time=datetime(day 9))
| entity_id | amount | _valid_from | _valid_to | Notes |
|---|---|---|---|---|
| A | 5 | Day 2 | Day 3 | Expires due to a new event. |
| A | 10 | Day 3 | Day 5 | Expires due to TTL. |
| A | 20 | Day 7 | Day 8 | Expires due to a new event. |
| A | 10 | Day 8 | Day 9 | May continue to be valid beyond Day 9. |
For Aggregate Feature Views, the feature value will cease to be valid if:
- A new event enters the sliding aggregation window and changes the aggregated feature value.
- An old event exits the sliding aggregation window and stops contributing to the aggregated feature value.
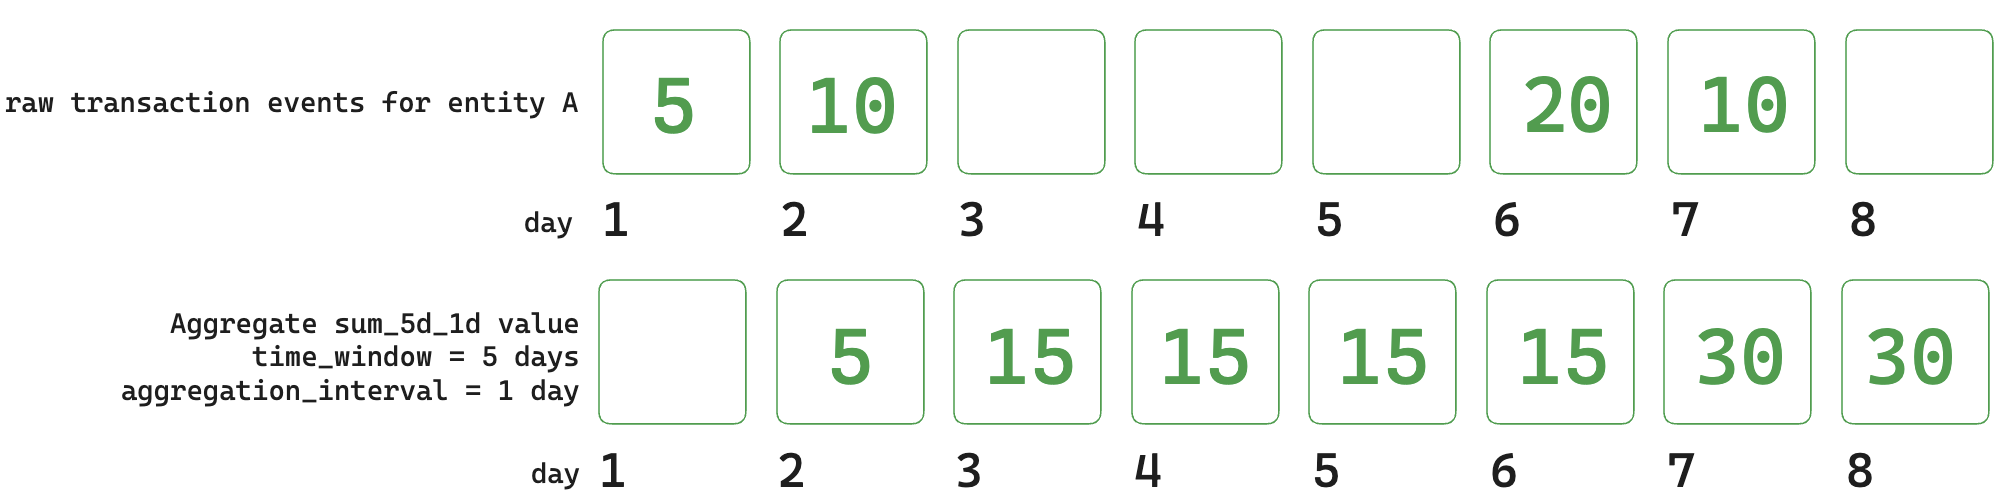
fv.get_features_in_range(start_time=datetime(day 1), end_time=datetime(day 9))
| entity_id | amount_sum_5d_1d | _valid_from | _valid_to | Notes |
|---|---|---|---|---|
| A | 5 | Day 2 | Day 3 | Expires due to a new event entering the sliding window. |
| A | 15 | Day 3 | Day 7 | Expires due to a new event entering and an old event exiting the sliding window. |
| A | 30 | Day 7 | Day 9 | A new event with the value 10 enters the window on Day 8, but an old event with the same value exits the window and the value remains unchanged till Day 9. |
Example Feature Views
For Example 1 and Example 2, we will use following Feature Views that compute features based on User Transaction Data.
user_transaction_amount is a Batch Feature View that stores the Transaction
Amount as a feature.
@batch_feature_view(
    description="User transaction metrics",
    sources=[transactions],
    entities=[user],
    mode="spark_sql",
    batch_schedule=timedelta(days=1),
    feature_start_time=datetime(2010, 1, 1),
)
def user_transaction_amount(transactions):
    return f"""
        SELECT user_id, timestamp, amount
        FROM {transactions}
        """
user_transaction_amount_agg is a Batch Feature View that uses
Tecton-Managed Aggregations
to compute the sum and max of the transaction amount over 1, 7, and 30 day
time windows.
@batch_feature_view(
    description="User transaction metrics over 1, 7, and 30 days",
    sources=[transactions],
    entities=[user],
    mode="spark_sql",
    aggregation_interval=timedelta(days=1),
    feature_start_time=datetime(2010, 1, 1),
    timestamp_field="timestamp",
    features=[
        Aggregate(function="max", input_column=Field("amount", Float32), time_window=timedelta(days=1)),
        Aggregate(function="max", input_column=Field("amount", Float32), time_window=timedelta(days=7)),
        Aggregate(function="max", input_column=Field("amount", Float32), time_window=timedelta(days=30)),
        Aggregate(function="sum", input_column=Field("amount", Float32), time_window=timedelta(days=1)),
        Aggregate(function="sum", input_column=Field("amount", Float32), time_window=timedelta(days=7)),
        Aggregate(function="sum", input_column=Field("amount", Float32), time_window=timedelta(days=30)),
    ],
)
def user_transaction_amount_agg(transactions):
    return f"""
        SELECT user_id, timestamp, amount
        FROM {transactions}
        """
Example 1: Observing Feature Trends and Analytics
get_features_in_range() provides accurate feature values for a given time
range. Each row in the result includes the time period the feature values are
valid for. This helps us observe how feature values are changing over time which
can be useful for testing, monitoring and analytical use cases.
# Fetch features for a 1 month period
start = datetime(2021, 1, 1)
end = datetime(2021, 2, 1)
user_transaction_amount_results = user_transaction_amount.get_features_in_range(start_time=start, end_time=end)
user_transaction_amount_agg_results = user_transaction_amount_agg.get_features_in_range(start_time=start, end_time=end)
display(user_transaction_amount_results)
| user_id | amount | _valid_from | _valid_to |
| user_1 | 28.26 | 2021-01-01T00:00:00 | 2021-01-10T00:00:00 |
| user_1 | 35.44 | 2021-01-10T00:00:00 | 2021-01-15T00:00:00 |
| user_1 | 35.44 | 2021-01-15T00:00:00 | 2021-02-01T00:00:00 |
| user_2 | 42.26 | 2021-01-01T00:00:00 | 2021-01-02T00:00:00 |
| user_2 | 1.13 | 2021-01-02T00:00:00 | 2021-01-28T00:00:00 |
| user_2 | 401.44 | 2021-01-28T00:00:00 | 2021-02-01T00:00:00 |
display(user_transaction_amount_agg_results)
| user_id | amount_max_1d_1d | amount_max_7d_1d | amount_max_30d_1d | amount_sum_1d_1d | amount_sum_7d_1d | amount_sum_30d_1d | _valid_from | _valid_to |
|---|---|---|---|---|---|---|---|---|
| user_1 | 10 | 10 | 10 | 10 | 10 | 10 | 2022-01-01T00:00:00 | 2022-01-02T00:00:00 |
| user_1 | null | 10 | 10 | null | 10 | 10 | 2022-01-02T00:00:00 | 2022-01-08T00:00:00 |
| user_1 | null | null | 10 | null | null | 10 | 2022-01-08T00:00:00 | 2022-01-10T00:00:00 |
| user_1 | 20 | 20 | 20 | 20 | 20 | 30 | 2022-01-10T00:00:00 | 2022-01-11T00:00:00 |
| user_1 | null | 20 | 20 | null | 20 | 30 | 2022-01-11T00:00:00 | 2022-01-15T00:00:00 |
| user_1 | 30 | 30 | 30 | 30 | 50 | 60 | 2022-01-15T00:00:00 | 2022-01-16T00:00:00 |
| user_1 | null | 30 | 30 | null | 50 | 60 | 2022-01-16T00:00:00 | 2022-01-17T00:00:00 |
| user_1 | null | 30 | 30 | null | 30 | 60 | 2022-01-17T00:00:00 | 2022-01-22T00:00:00 |
| user_1 | null | null | 30 | null | null | 60 | 2022-01-22T00:00:00 | 2022-01-31T00:00:00 |
| user_1 | null | null | 30 | null | null | 50 | 2022-01-31T00:00:00 | 2022-02-01T00:00:00 |
| user_2 | 5 | 5 | 5 | 5 | 5 | 5 | 2022-01-01T00:00:00 | 2022-01-02T00:00:00 |
| user_2 | 15 | 15 | 15 | 15 | 20 | 20 | 2022-01-02T00:00:00 | 2022-01-03T00:00:00 |
| user_2 | null | 15 | 15 | null | 20 | 20 | 2022-01-03T00:00:00 | 2022-01-08T00:00:00 |
| user_2 | null | 15 | 15 | null | 15 | 20 | 2022-01-08T00:00:00 | 2022-01-09T00:00:00 |
| user_2 | null | null | 15 | null | null | 20 | 2022-01-09T00:00:00 | 2022-01-28T00:00:00 |
| user_2 | 25 | 25 | 25 | 25 | 25 | 45 | 2022-01-28T00:00:00 | 2022-01-29T00:00:00 |
| user_2 | null | 25 | 25 | null | 25 | 45 | 2022-01-29T00:00:00 | 2022-01-31T00:00:00 |
| user_2 | null | 25 | 25 | null | 25 | 40 | 2022-01-31T00:00:00 | 2022-02-01T00:00:00 |
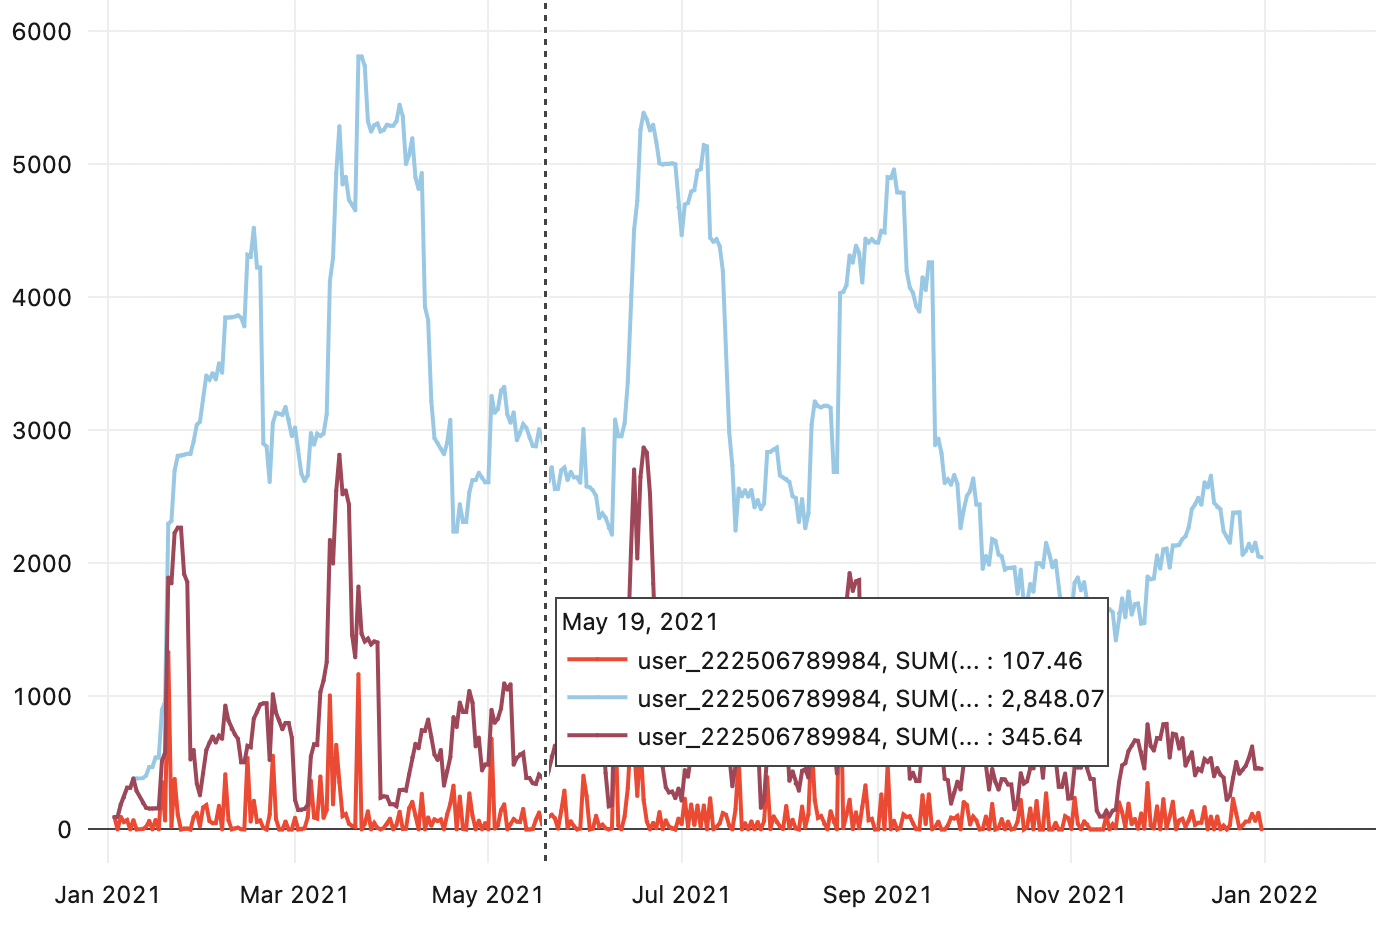
The results from get_features_in_range() can now be visualized to observe
feature trends or tracked for monitoring purposes.
Example 2: Point-in-time Joins
You can also use the results of get_features_in_range() to implement your own
custom point-in-time join.
We can implement this by building a dataframe with join key columns and
timestamps for which we would like to fetch values and performing a join
operation against the results of get_features_in_range().
Assume you have a table called events with the join keys and timestamps for
which we would like to retrieve features.
| user_id | timestamp |
|---|---|
| user_1 | 2022-01-10T12:00:00 |
| user_1 | 2022-01-15T01:00:00 |
| user_2 | 2022-01-02T10:00:00 |
| user_2 | 2022-01-28T20:00:00 |
We can now join this table against the results of get_features_in_range() to
get point-in-time accurate feature values
# `events` is the "input" dataframe described above
# `aggregate_results` is the output of `get_features_in_range()` from Example 1
result = events.join(
    aggregate_results,
    (events.timestamp >= aggregate_results._valid_from)
    & (events.timestamp < aggregate_results._valid_to)
    & (events.user_id == aggregate_results.user_id),
    "left",
).drop("_valid_from", "_valid_to")
display(result)
| user_id | timestamp | amount_max_1d_1d | amount_max_7d_1d | amount_max_30d_1d | amount_sum_1d_1d | amount_sum_7d_1d | amount_sum_30d_1d |
|---|---|---|---|---|---|---|---|
| user_1 | 2022-01-10T12:00:00 | 20 | 20 | 20 | 20 | 20 | 30 |
| user_1 | 2022-01-15T01:00:00 | 30 | 30 | 30 | 30 | 50 | 60 |
| user_2 | 2022-01-02T10:00:00 | 15 | 15 | 15 | 15 | 20 | 20 |
| user_2 | 2022-01-28T20:00:00 | 25 | 25 | 25 | 25 | 25 | 45 |
This operation is functionally equivalent to
get_features_for_events().
get_features_for_events(events, ...)
For
BatchFeatureView,
StreamFeatureView,
RealtimeFeatureView,
FeatureTable
and
FeatureService.
Overview
This method is used to retrieve historical feature values by joining an input
DataFrame events with the feature data.
The events DataFrame contains all the join key columns and a timestamp column.
The join key combinations identify the entities for which we would like to
retrieve features. The timestamp column specifies the timestamp to which we
would like to time-travel and compute feature values.
For more details on how this method works, see Construct Training Data.
Example
We will reuse the user_transaction_amount_agg Feature View and
events DataFrame from the examples above
# Using the same `events` dataframe described above
result = user_transaction_amount_agg.get_features_for_events(events).to_spark()
display(result)
| user_id | timestamp | amount_max_1d_1d | amount_max_7d_1d | amount_max_30d_1d | amount_sum_1d_1d | amount_sum_7d_1d | amount_sum_30d_1d |
|---|---|---|---|---|---|---|---|
| user_1 | 2022-01-10T12:00:00 | 20 | 20 | 20 | 20 | 20 | 30 |
| user_1 | 2022-01-15T01:00:00 | 30 | 30 | 30 | 30 | 50 | 60 |
| user_2 | 2022-01-02T10:00:00 | 15 | 15 | 15 | 15 | 20 | 20 |
| user_2 | 2022-01-28T20:00:00 | 25 | 25 | 25 | 25 | 25 | 45 |
run_transformation(start_time, end_time, mock_inputs)
For
BatchFeatureView,
StreamFeatureView
and
RealtimeFeatureView
Overview
This method is useful to quickly iterate and test a Feature View's Transformation logic before the effect of any Tecton-Managed Aggregation.
Examples
Example running a Realtime Feature View with mock data
@realtime_feature_view(
    sources=[transaction_request, user_transaction_amount_metrics],
    mode="python",
    features=output_features,
    description="The transaction amount is higher than the 1 day average.",
)
def transaction_amount_is_higher_than_average(request, user_metrics):
    return {"higher_than_average": request["amt"] > user_metrics["daily_average"]}
You can retrieve and run the Feature View in a notebook using mock data:
import tecton

fv = tecton.get_workspace("prod").get_feature_view("transaction_amount_is_higher_than_average")
input_data = {"request": {"amt": 100}, "user_metrics": {"daily_average": 1000}}

result = fv.run_transformation(input_data=input_data)
print(result)  # {'higher_than_average': False}:
Example running a Batch Feature View with mock data
import tecton
import pandas
from datetime import datetime

feature_view = tecton.get_workspace("my_workspace").get_feature_view("my_feature_view")

mock_fraud_user_data = pandas.DataFrame(
    {
        "user_id": ["user_1", "user_2", "user_3"],
        "timestamp": [datetime(2022, 5, 1, 0), datetime(2022, 5, 1, 2), datetime(2022, 5, 1, 5)],
        "credit_card_number": [1000, 4000, 5000],
    }
)

result = feature_view.run_transformation(
    start_time=datetime(2022, 5, 1),
    end_time=datetime(2022, 5, 2),
    mock_inputs={"fraud_users_batch": mock_fraud_user_data},
)  # `fraud_users_batch` is the name of this FeatureView's data source parameter.