Online Serving
This guide helps you monitor and troubleshoot high latencies and serving errors in Tecton's online serving. It covers common situations causing these issues and provides steps to debug and resolve them effectively.
The retention window for metrics is 60 days.
Online Serving Monitoring
We expose the following dashboards that can help you monitor your latency and performance.
Overall Feature Serving Dashboard
Link:
https://<cluster_name>.tecton.ai/app/repo/prod/feature-services/feature-server-monitoring
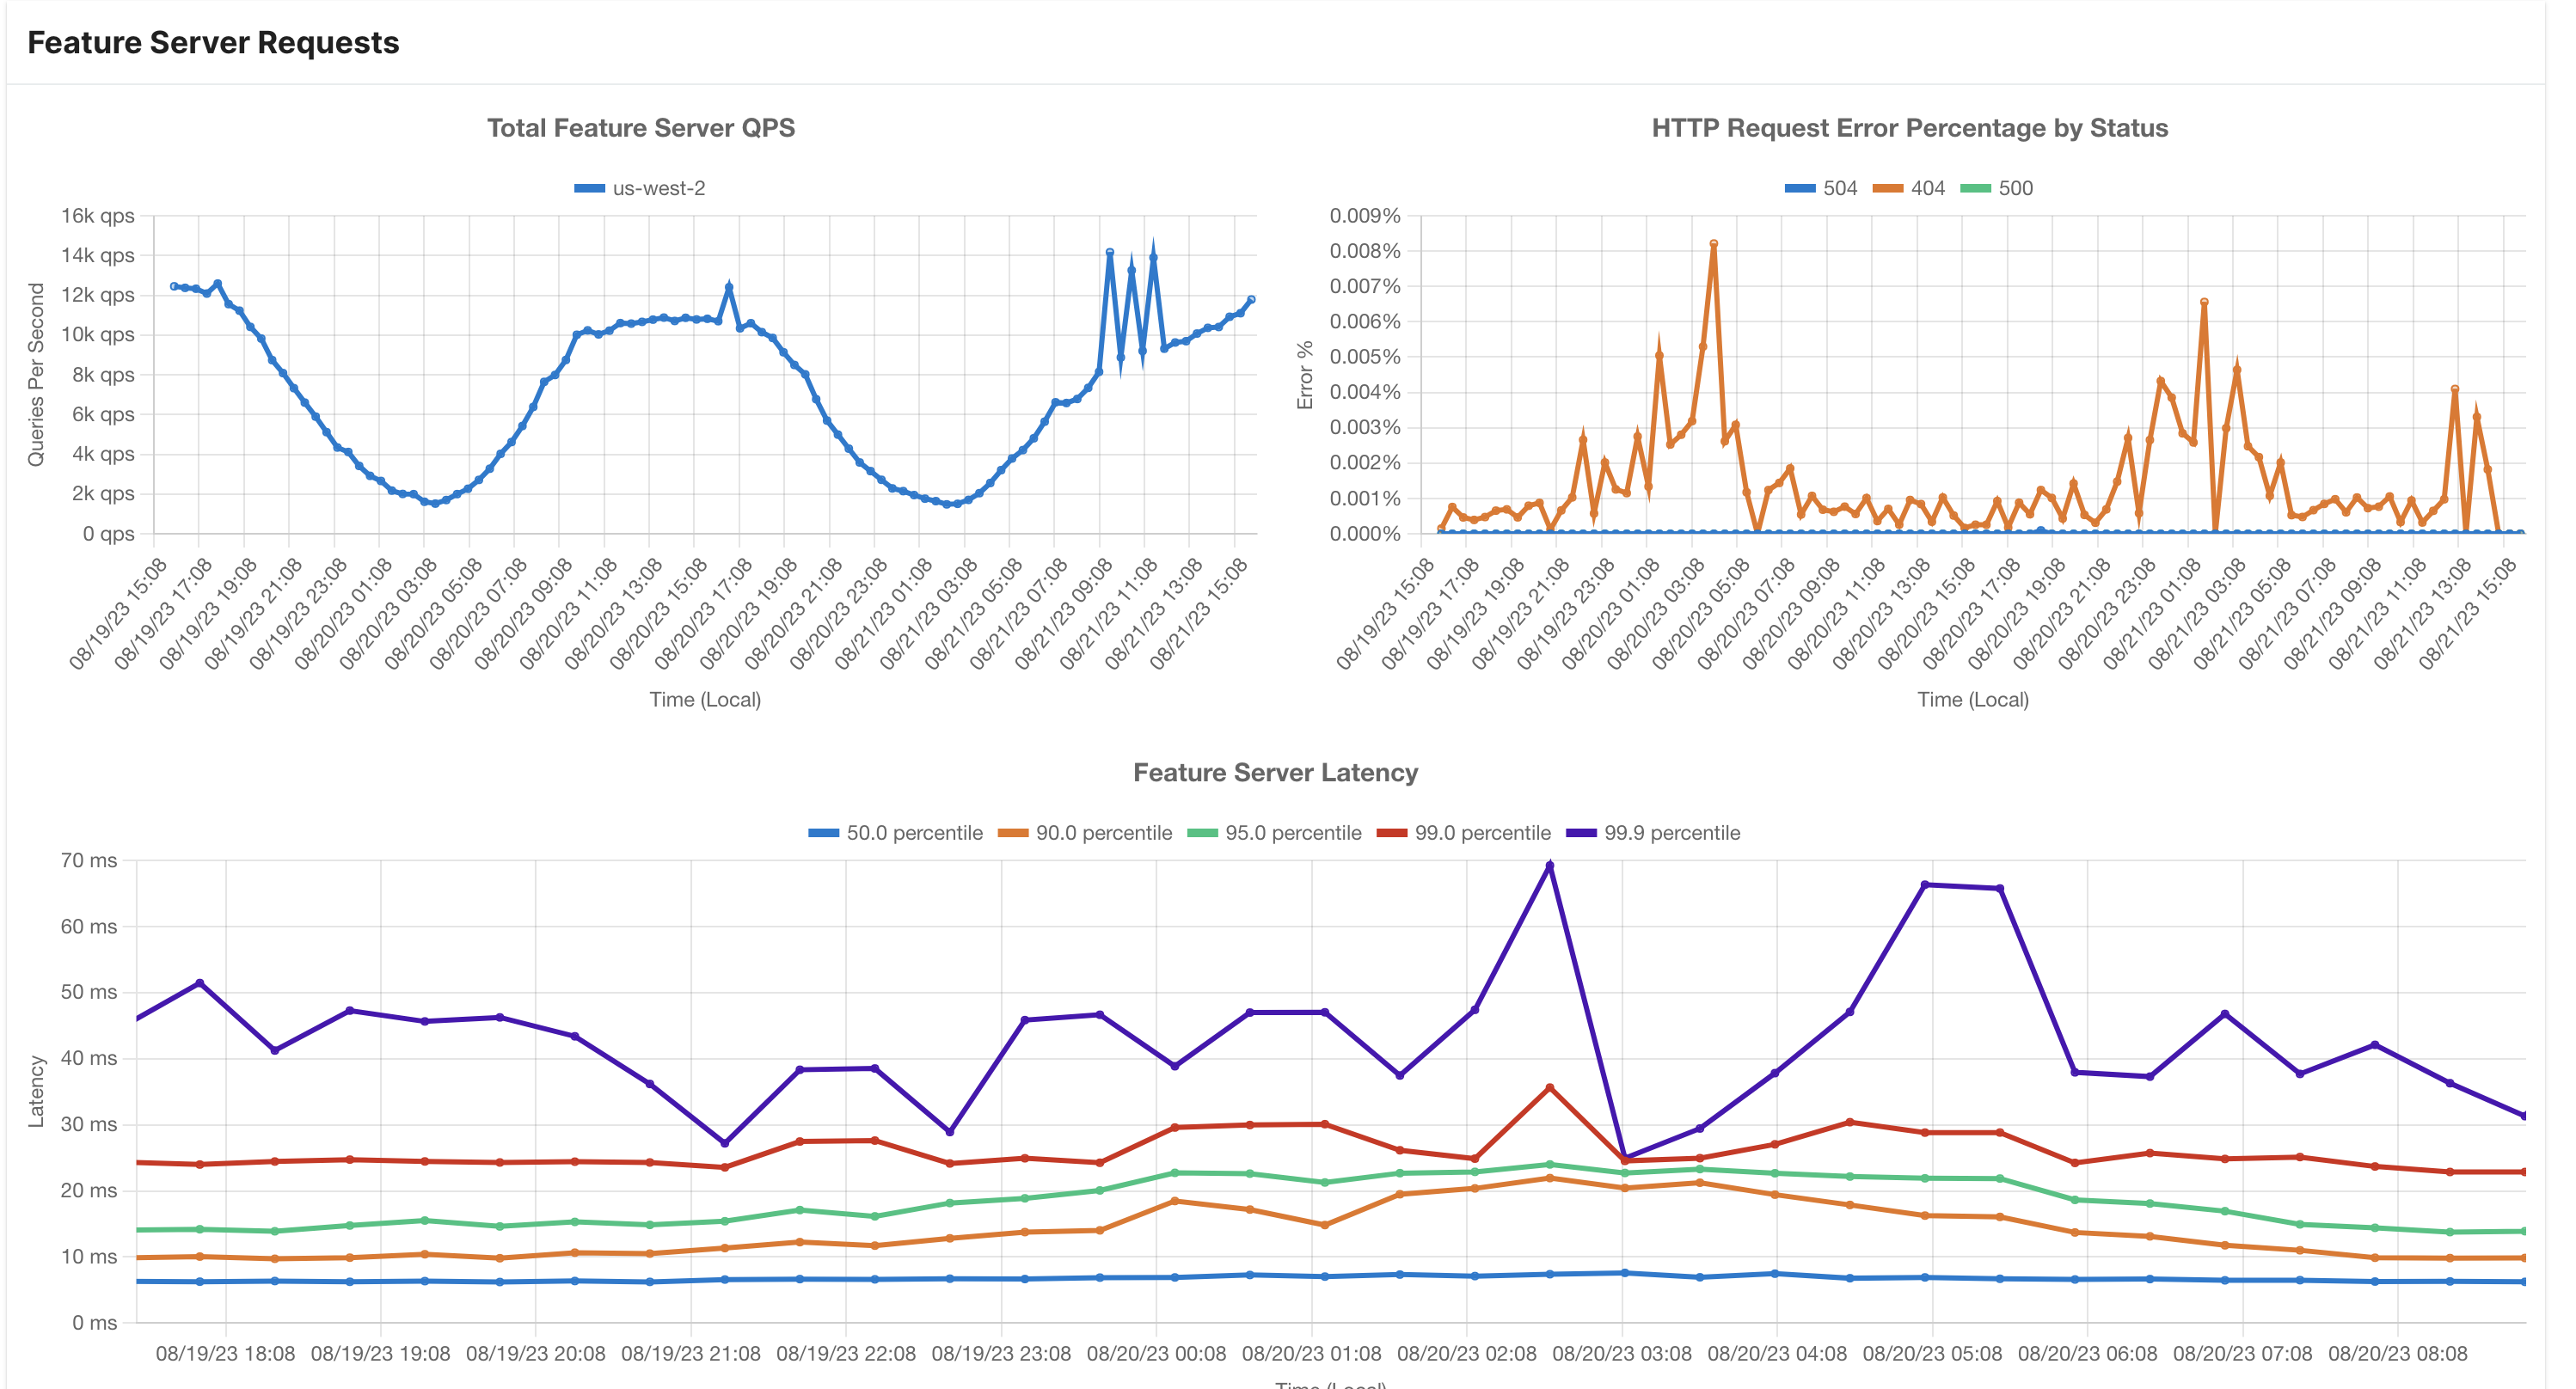
This dashboard provides information about Tecton's online serving capabilities. It's a great starting point for understanding how the system is performing.
Here's what you'll find on the dashboard:
- Total Online Serving QPS: This shows the total number of queries per second across all workspaces and feature services in the cluster aggregated by region.
- Latency Distribution: You'll see various latency percentiles (p50, p90, p95, and p99) displayed in milliseconds. These help you understand how quickly queries are being processed.
- Error Distribution: This section displays the percentage of queries that resulted in errors, categorized by different error codes.
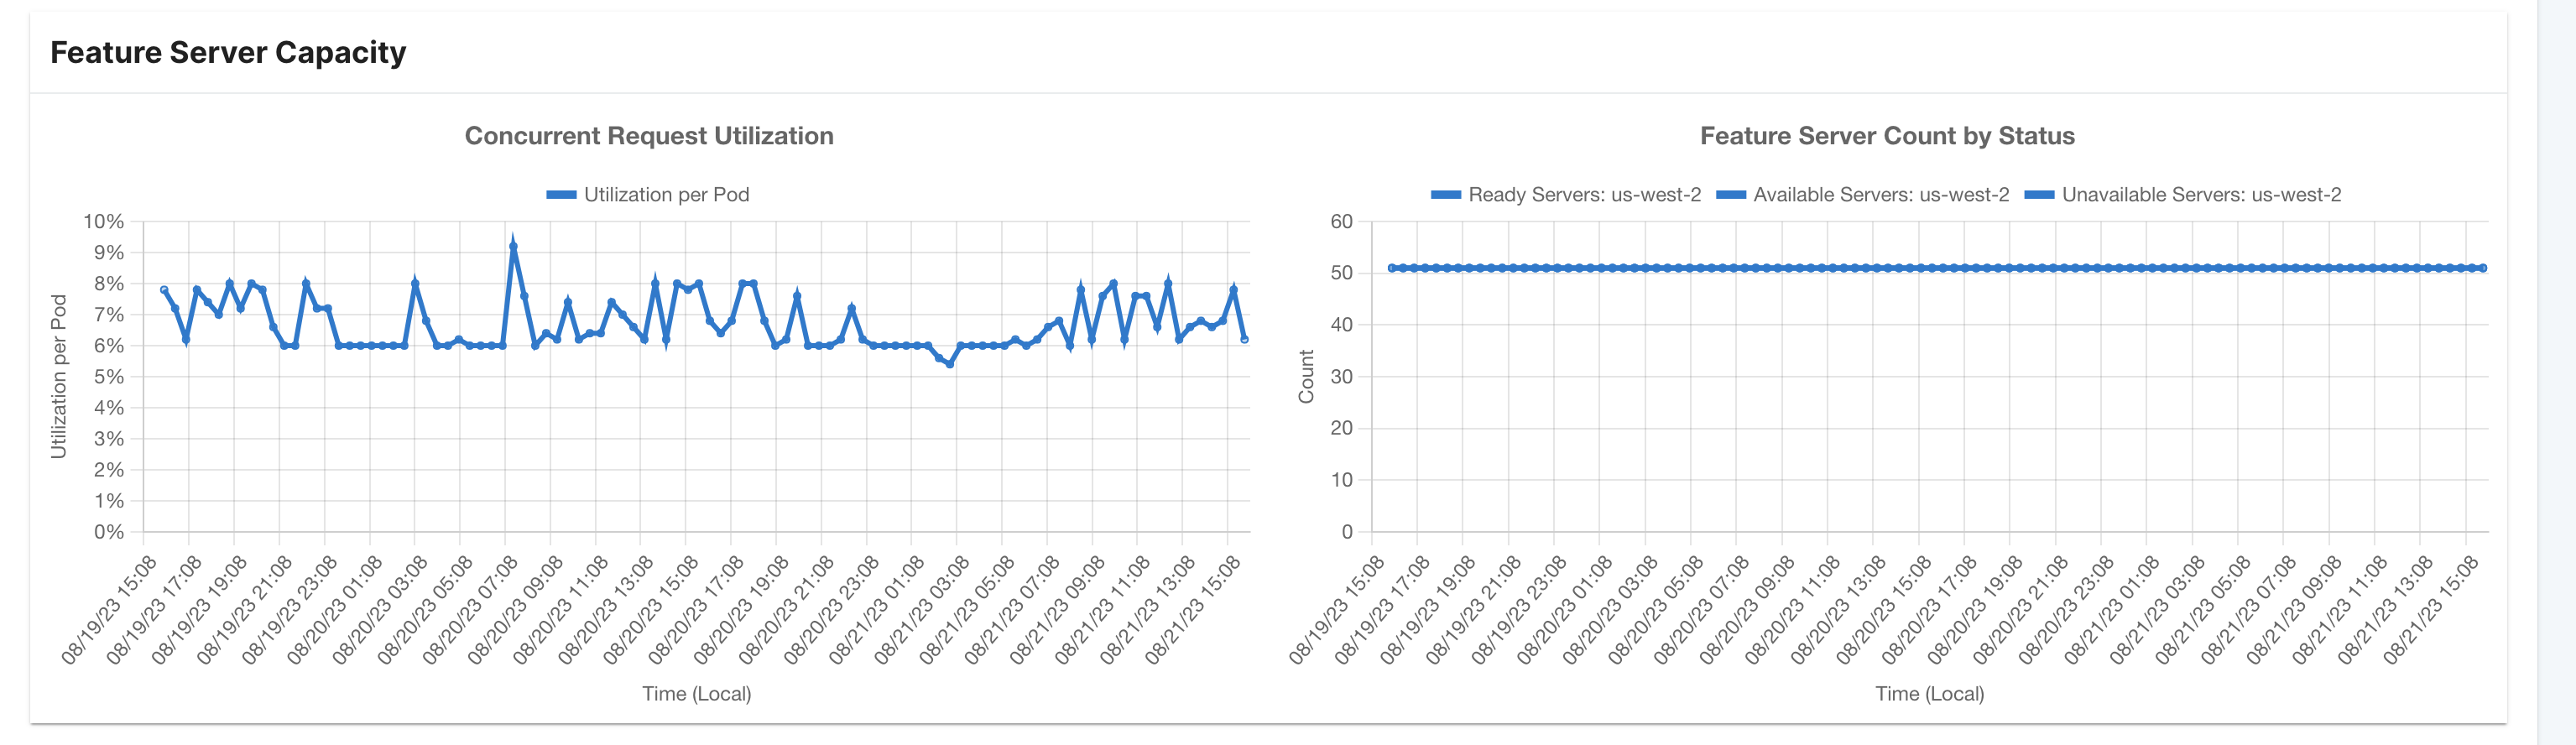
- Online Serving Capacity: In this part, you'll find:
- Percentage Utilization: Minimum, maximum, and average utilization of Tecton's online serving infrastructure as a percentage of the maximum before throttling occurs.
- Count of Feature Servers by Status: This breaks down the number of feature servers in different statuses, such as Ready, Available, and Unavailable, aggregated by region.
Online Store Dashboard
Link:https://<cluster_name>.tecton.ai/app/repo/prod/feature-services/feature-server-monitoring
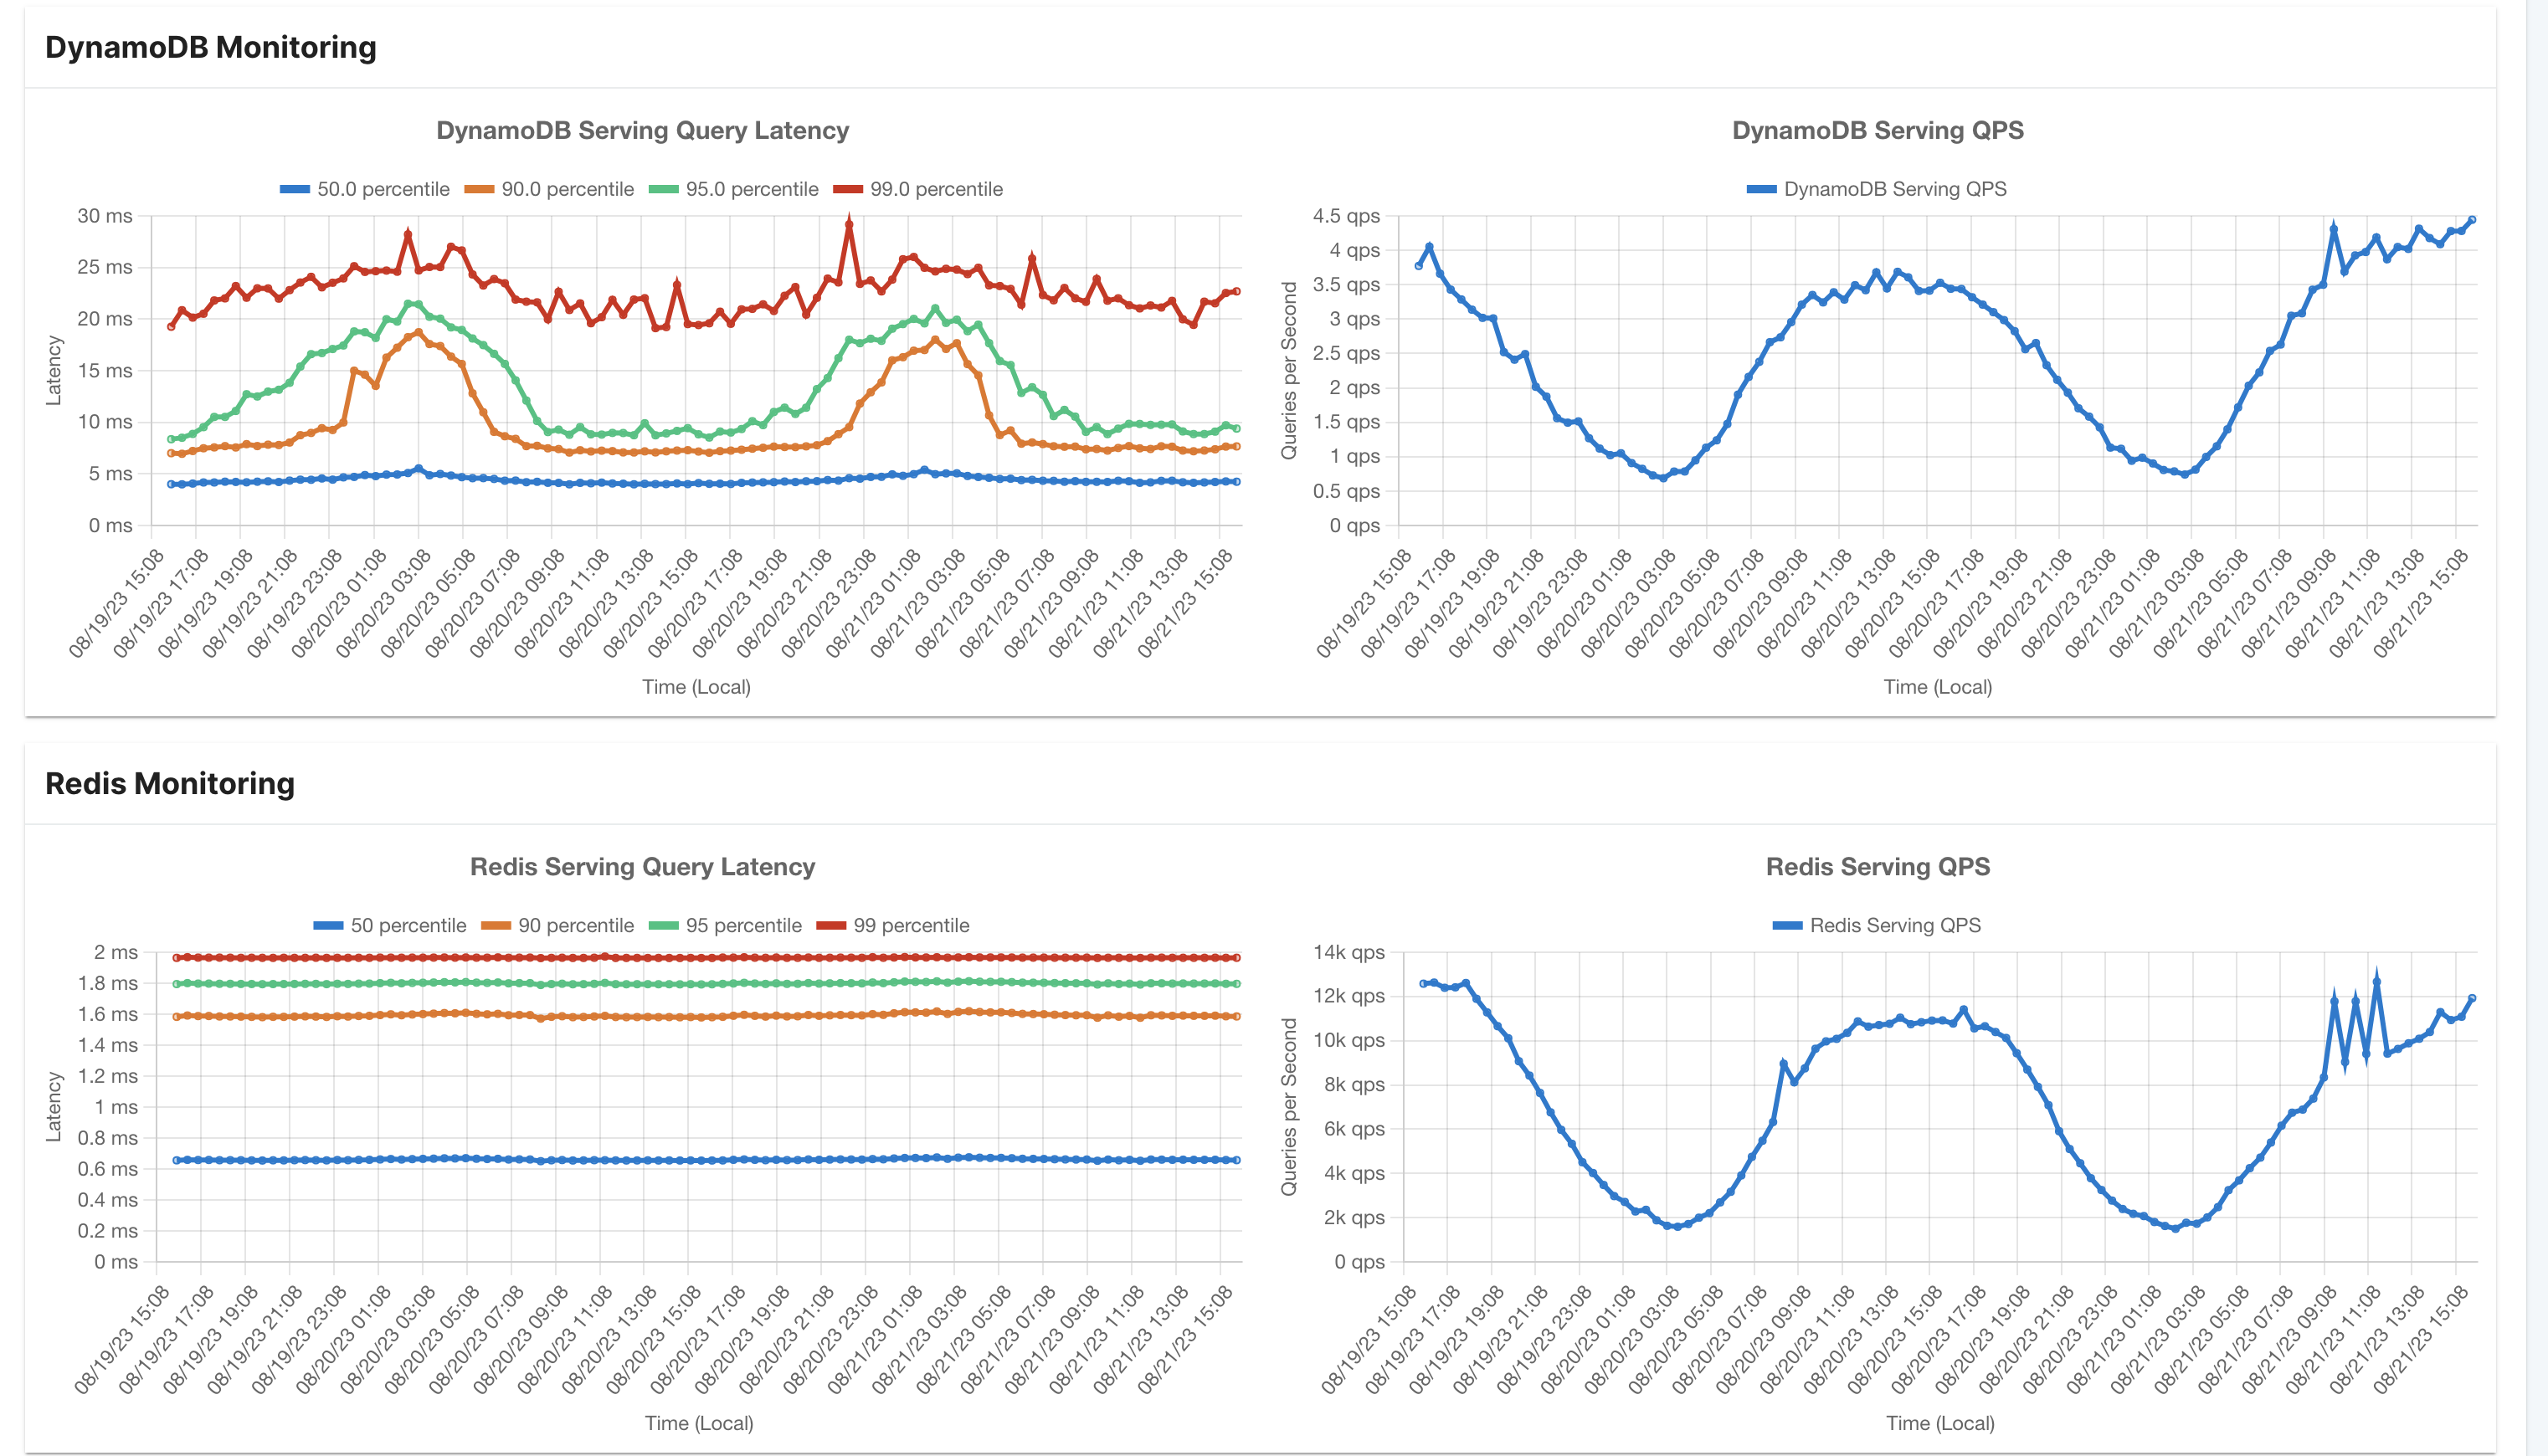
This dashboard provides a comprehensive representation of the online storage linked to the Tecton platform. This dashboard proves particularly valuable for gaining insights into Online Store performance monitoring.
1. DynamoDB Monitoring
- Latency Distribution: This section showcases latency statistics such as p50, p90, p95, and p99, measured in milliseconds, for all DynamoDB read queries.
- Total Online Serving QPS: Here, you'll find the aggregate count of Queries Per Second (QPS) for all DynamoDB read queries.
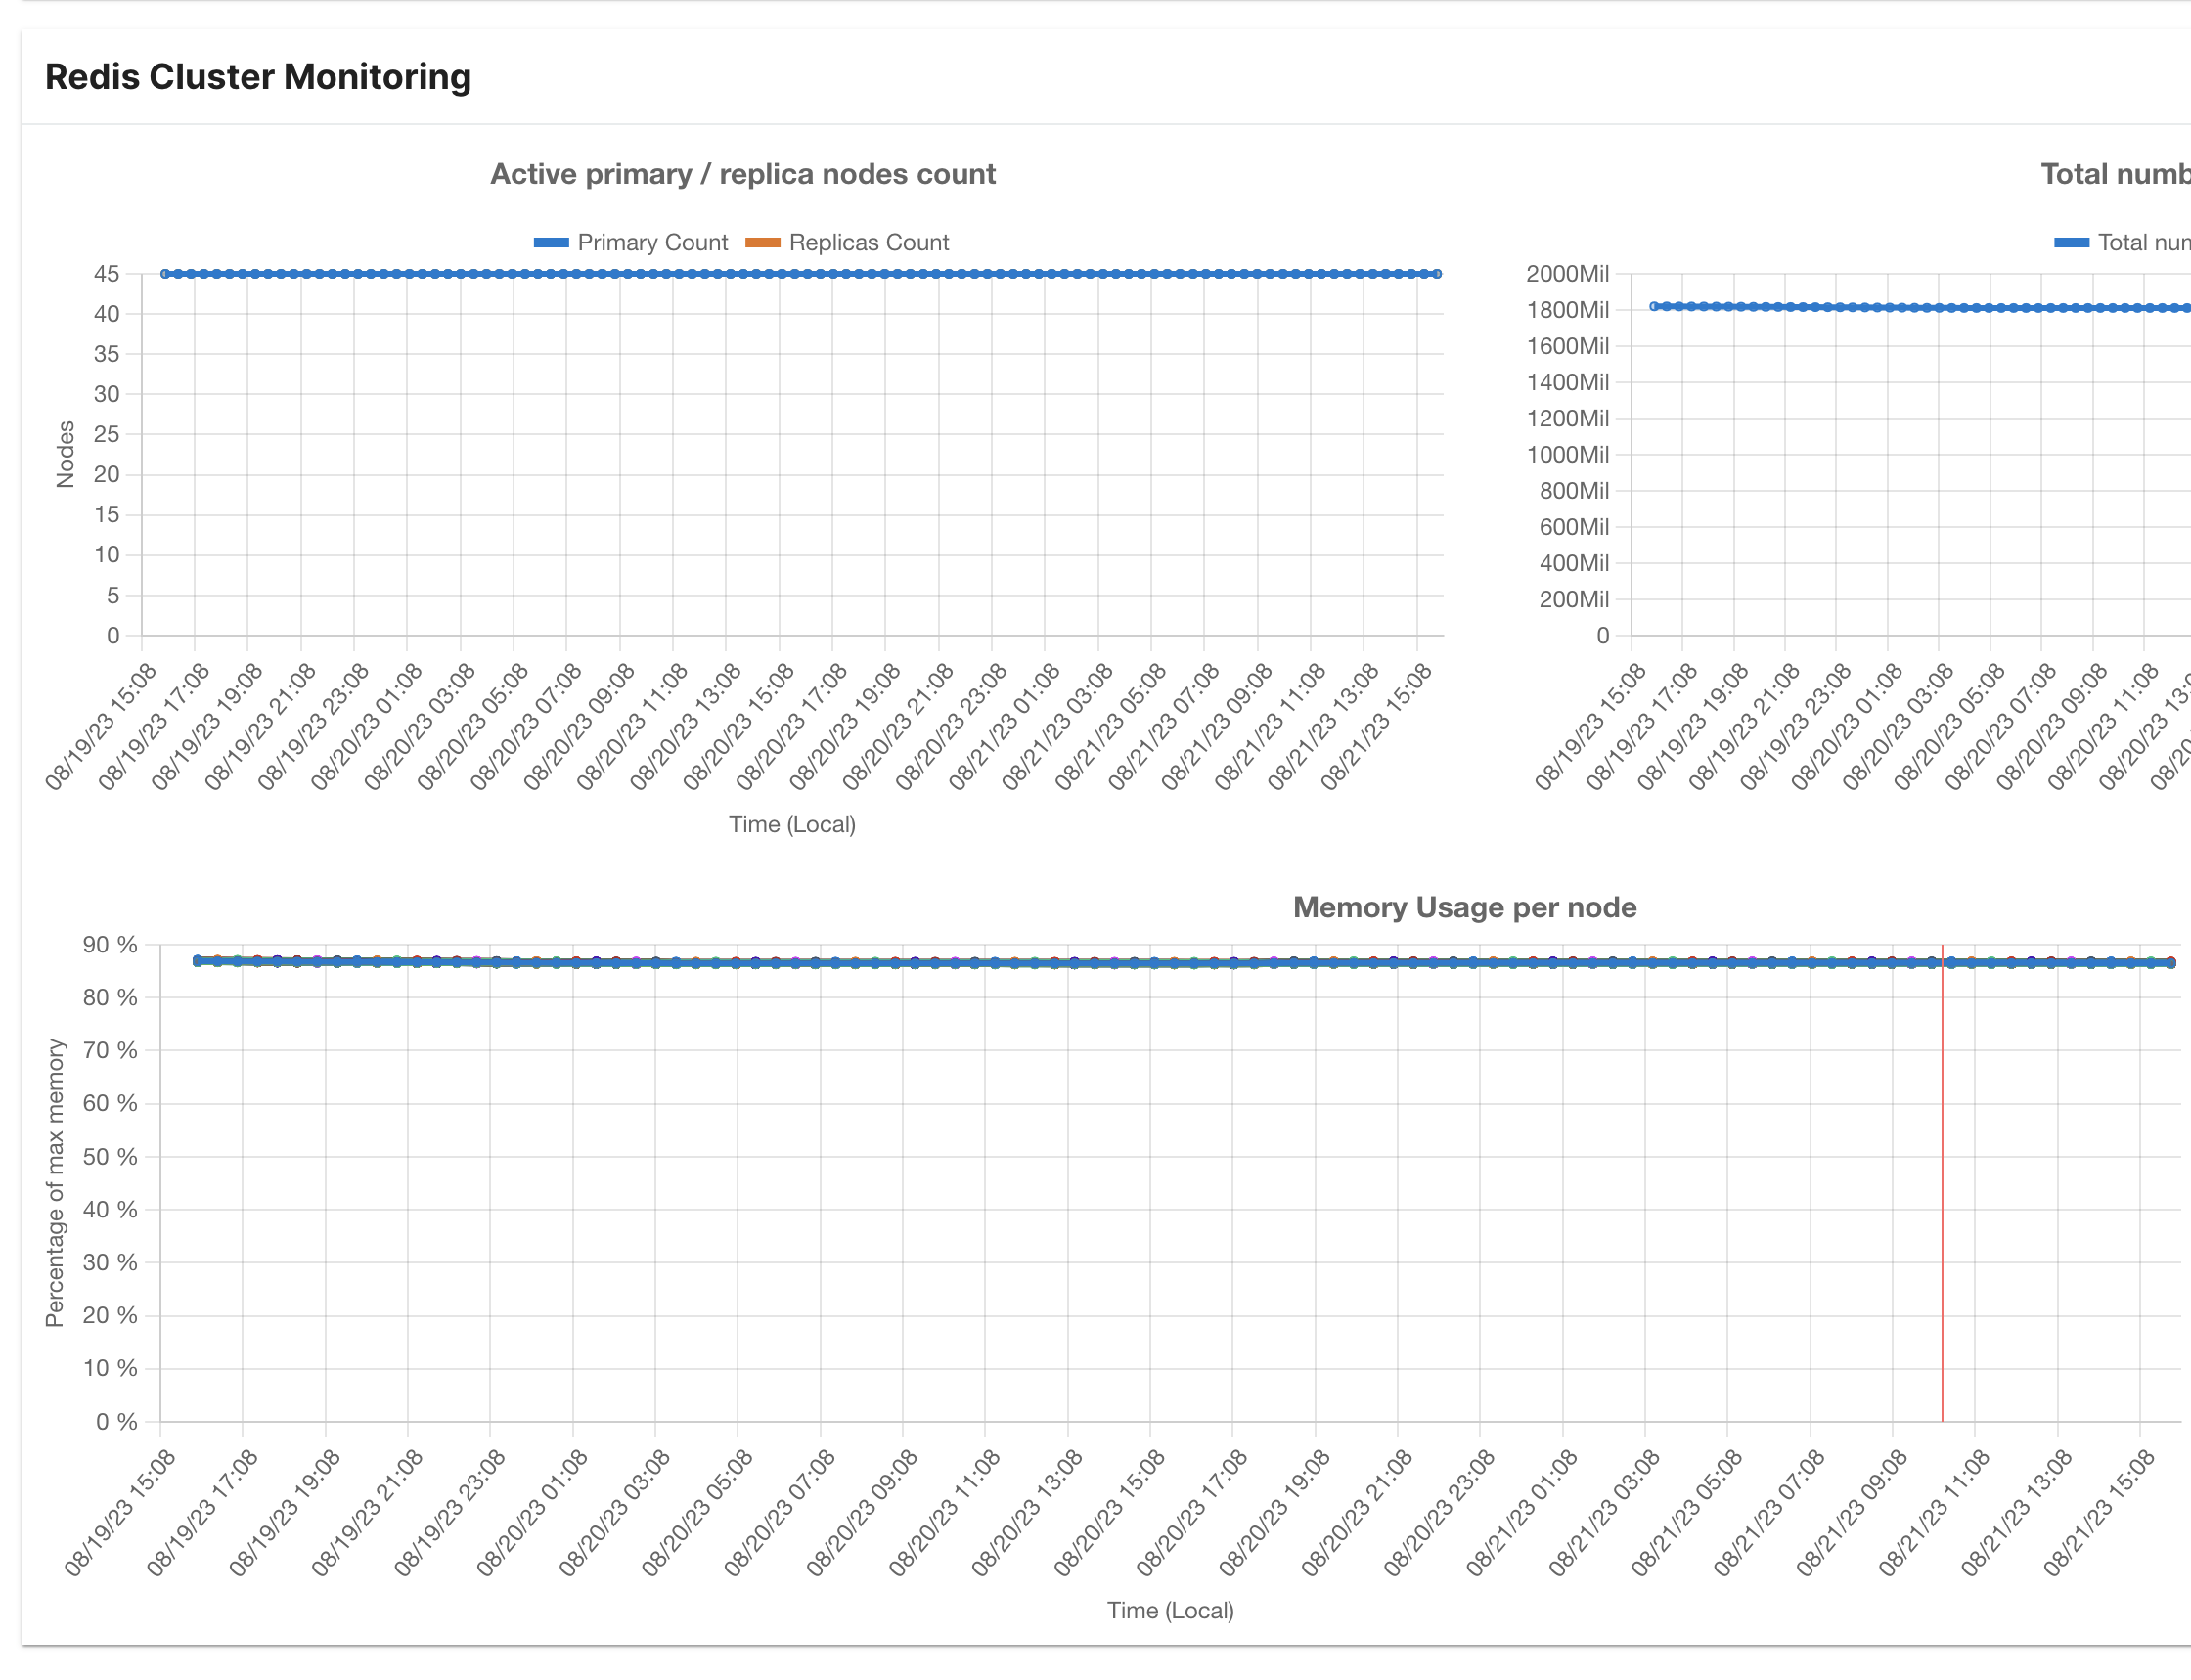
2. Redis Monitoring
- Latency Distribution: This segment presents latency metrics (p50, p90,
p95, and p99 in milliseconds) for all Redis read queries.
- Total Online Serving QPS: This metric quantifies the overall Queries Per Second (QPS) for all Redis read queries.
- Node Count: The number of primary and replica nodes in the Redis cluster is displayed here.
- Node Memory Usage: This section offers insights into the memory consumption of each individual node within the cluster.
- Key Count: The total count of keys stored in the Redis cluster is showcased here.
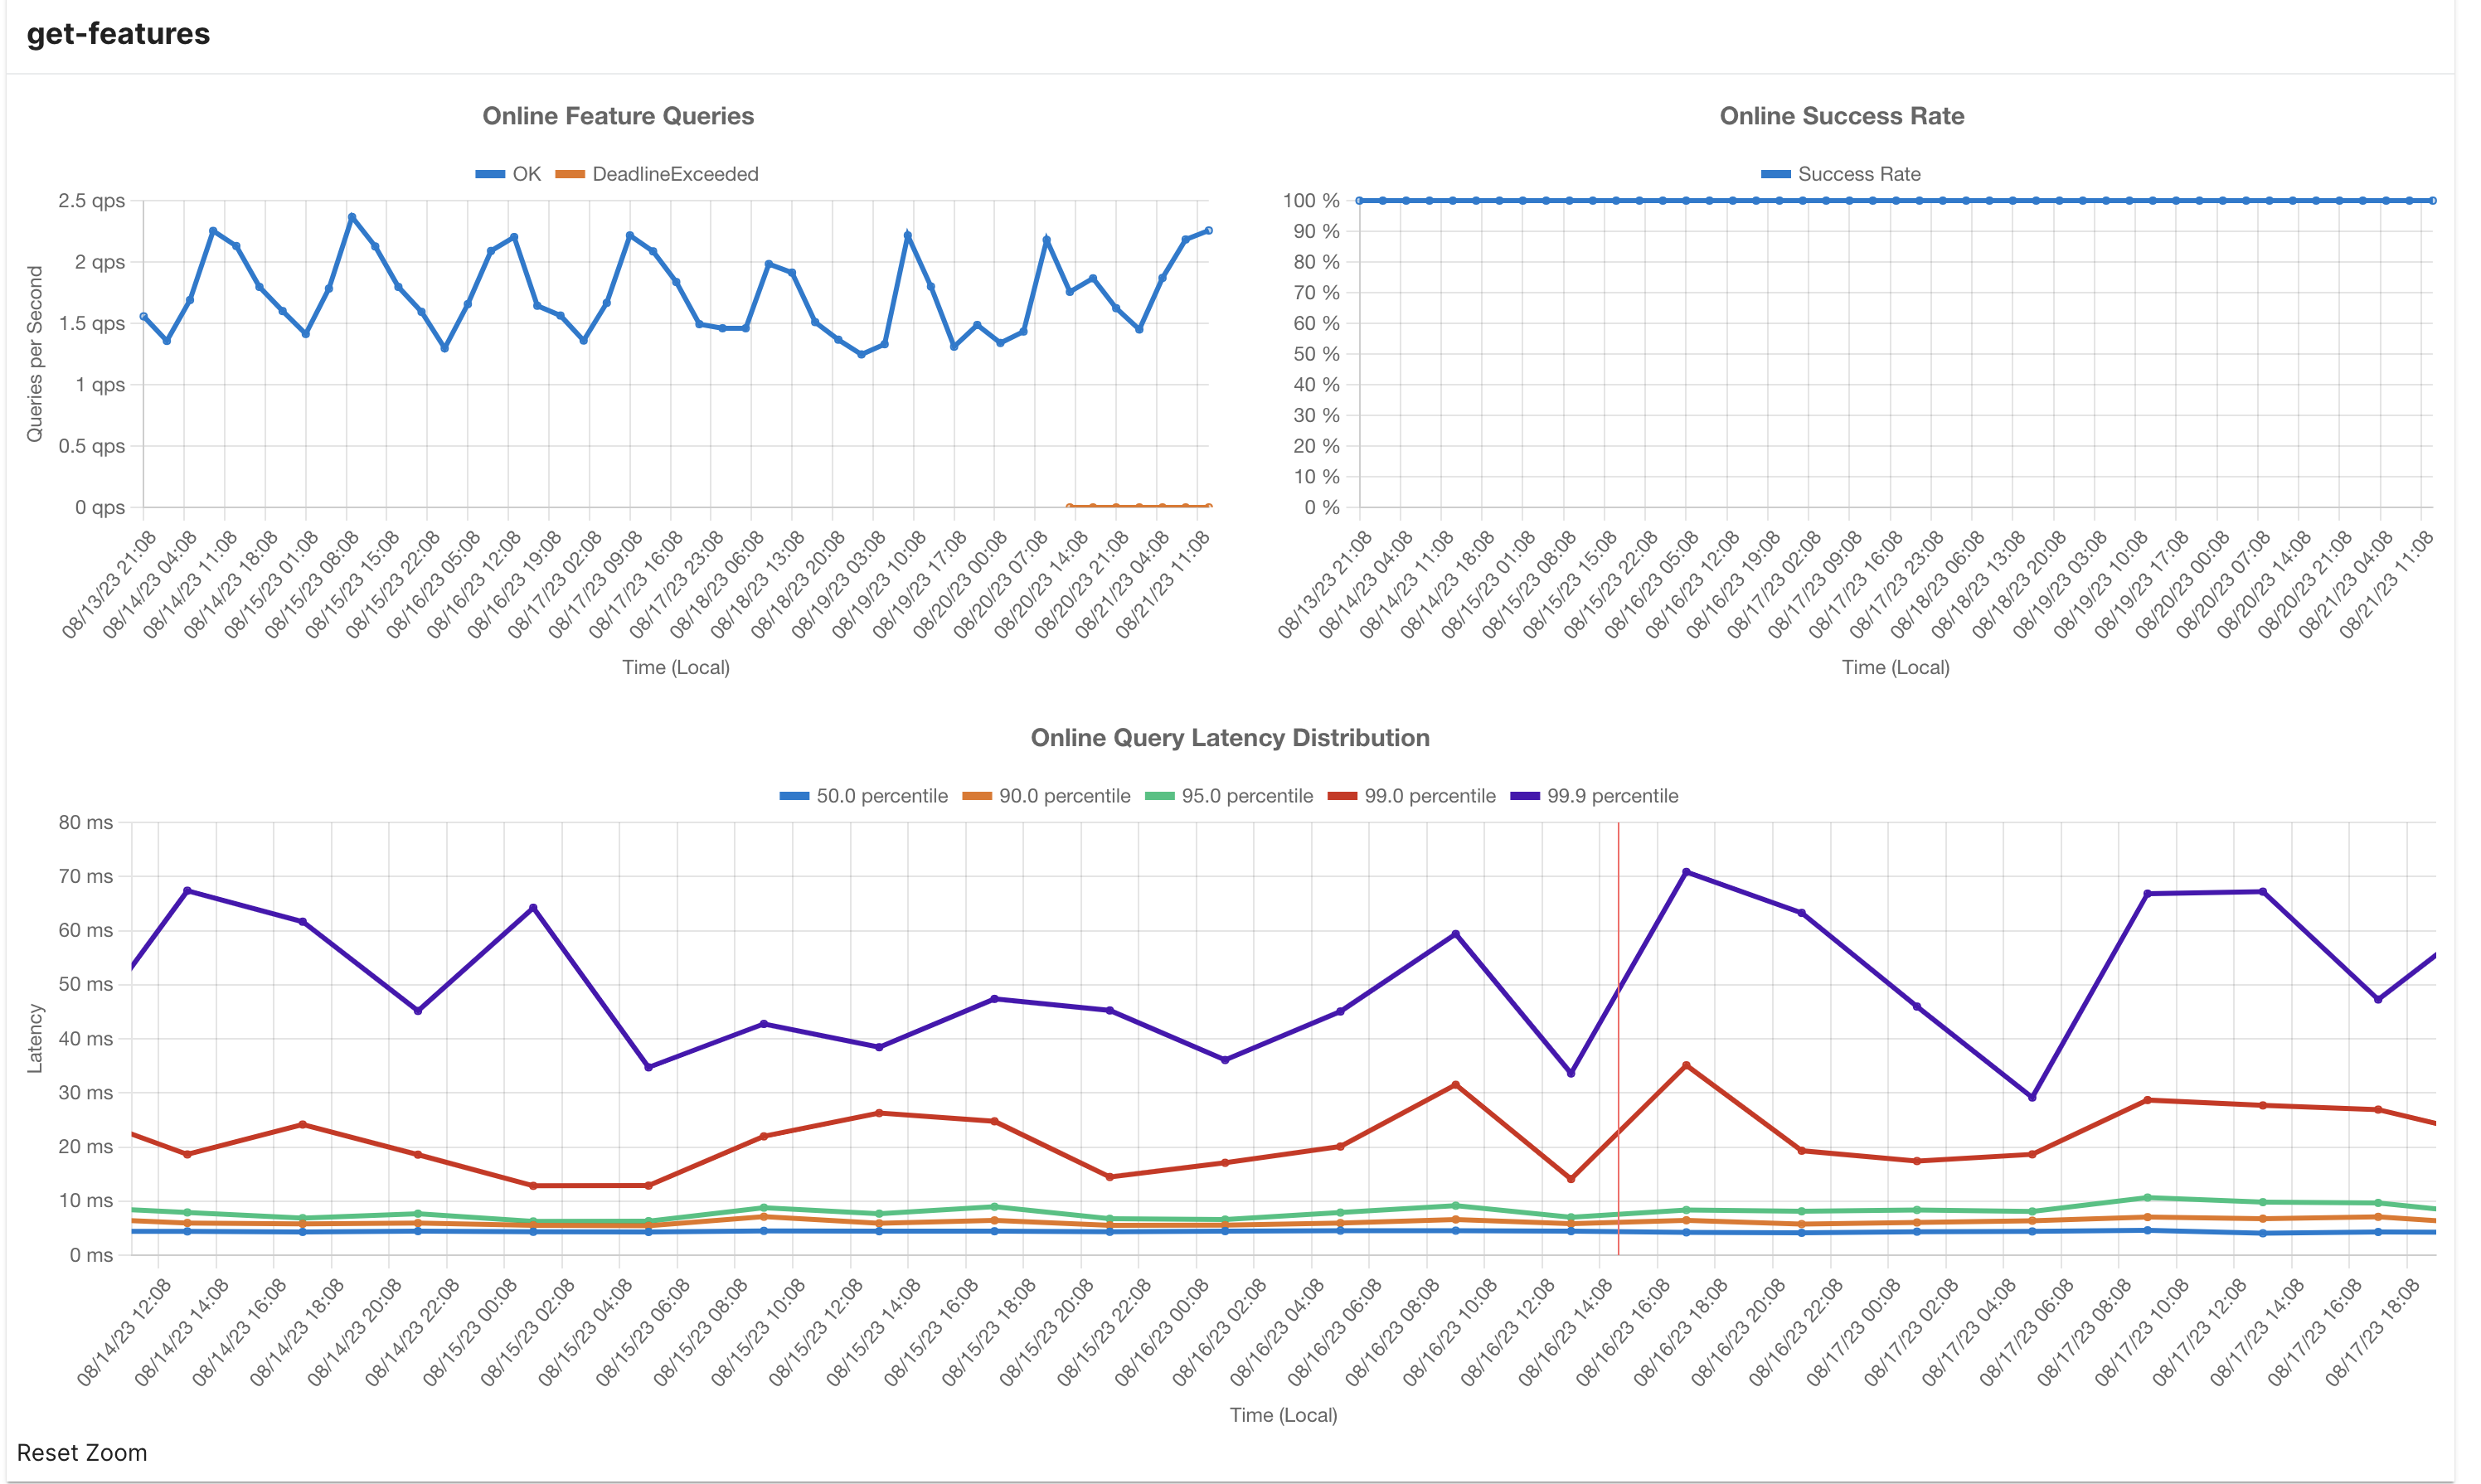
Feature Service Dashboard
Link:
https://<cluster_name>.tecton.ai/app/repo/<workspace>/feature-services/<feature_service_name>/monitoring
This dashboard provides a information about a specific feature service.
- Online Feature Queries per Second: This metric indicates the rate of online feature queries being executed every second for this feature service.
- Online Success Rate: The Online Success Rate denotes the percentage of queries that yield a 200 response code, indicating successful execution.
- Latency Distribution (in milliseconds): This section showcases latency distribution statistics, including percentiles such as p50, p90, p95, and p99. These values provide insights into the varying response times of the feature service.
Feature Service HTTP API Metadata
For every feature service request, you can pass in the extra metadata options to include SLO Info. More info on this is present in our API Reference : Reading Online Features Using the HTTP API guide.
"metadataOptions": {
	"includeSloInfo": true
}
When making a request using the provided input, the subsequent response includes the following enriched metadata:
- SLO Eligibility: This field denotes whether the executed query meets the
criteria for Service Level Objective (SLO) eligibility. A request is
considered SLO-Eligible if it satisfies the following conditions:
- The total bytes fetched from the online store is less than or equal to 2MB.
- If Redis serves as the Online Store, Redis queries respond in less than or equal to 25ms.
- SLO Server Time Seconds: This metric indicates the time taken by the server to process the request, minus any duration spent waiting for on-demand transformations to complete. It is a crucial indicator for assessing compliance with the Service Level Objective.
- Server Time Seconds: This measurement encompasses the entire duration spent within the feature server's operations. It encapsulates online transformations, data retrieval from the online store, and any time spent performing request-time aggregations.
- Store Max Latency: Representing the highest observed latency, measured in seconds, among all queries made to the online store as an integral part of serving the feature service query.
- Store Response Size Bytes: This value signifies the cumulative size in bytes of data read from the online store to fulfill the feature service query successfully.
By integrating this detailed metadata into the HTTP API response, users gain valuable insights into the system's performance and adherence to SLOs. This information equips users with the tools to monitor and optimize their interactions with the system effectively.
Example:
"sloInfo": {
	"sloEligible": true,
	"sloServerTimeSeconds": 0.015835683,
	"serverTimeSeconds": 0.016889888,
	"storeMaxLatency": 0.02687345,
	"storeResponseSizeBytes": 23722
}
Debugging High Online Serving Latencies
In scenarios where online serving latencies are higher than expected, the following factors could be contributing to the issue:
High Online Store Latencies
High latencies during online serving can often be attributed to delays in retrieving features from the underlying low-latency storage. Some frequent causes of these latency issues include:
Under-provisioned Online Store
- DynamoDB: Tecton leverages DynamoDB in autoscaling mode. In cases where the request volume to a Feature View doubles within less than 30 minutes, elevated latencies and throttling might occur. During this period, DynamoDB's autoscaling mechanism adjusts resources to match the increased throughput. Typically, scaling takes a few minutes, after which latencies should normalize.
- Redis: Tecton relies on customer-managed Redis, and adequate provisioning of Redis Clusters is the responsibility of the customers. If your Redis Cluster is under-provisioned, it can lead to heightened serving-side latencies.
DynamoDB occasionally encounters internal errors other than throttling. In instances where the error is indeed linked to throttling, we return responses with an HTTP 429 status. Other Internal DynamoDB errors will result in responses with server errors (responses with status codes in the HTTP 5xx range) with the messages as returned by DynamoDB.
Where can I monitor this?
Online Store Monitoring Dashboard
What should I do?
- For DynamoDB autoscaling, ensure your request volume does not double in less than 30 minutes. If it does happen, you must wait for it to autoscale.
- Utilize Tecton's integrated Redis monitoring capabilities for monitoring. This
is present in the Online Store Monitoring Dashboard linked above.
- If Redis Memory/CPU utilization is high, consider scaling up your cluster. More information can be found at Managing Your Redis Cluster.
- Avoid hot keys or hitting a single entity key for a given feature view at very high QPS. For DynamoDB, there is a cap of 3000 QPS per entity key.
Fetching Large Data Volumes at Read Time
-
Large Aggregations during Request Time: For aggregate feature views, data is fetched and aggregated during request time within a specified window. The number of rows retrieved for the given entity hinges on the aggregation window and interval. Larger aggregation windows combined with smaller intervals lead to a higher volume of data being processed at request time, causing increased latencies.
DynamoDB has a 2MiB response limit and this limit can be reached when a feature view aggregation window or feature Service returns too many events. When this happens, an error related to the maximum response size is reported. This is one potential cause of a
FailedPreconditionerror. -
Numerous Features in a Single Feature Service: Feature services containing many features or feature views can trigger heightened latencies.
Where can I monitor this?
Store Response Size Bytes: This value signifies the cumulative size in bytes of data read from the online store to fulfill the feature service query successfully. You can monitor this here.
What should I do?
- Ensure that your online serving queries are fetching fewer data at request
time.
- Fine-tune aggregation windows and intervals to balance freshness and query performance for aggregate feature views. For example, a streaming feature view in continuous mode with a large aggregation window can cause issues. Read Understanding Performance and costs of aggregation features for more information on how you can optimize this.
- For feature services with lots of features, consider splitting across feature services. The goal should be to ensure that the amount of data being retrieved for a single feature service request is under 2MB.
Under-provisioned feature serving capacity
Tecton's online serving infrastructure may not be adequately provisioned to handle your traffic. Before production, we will work with you to scale your feature servers to handle your expected load with headroom to allow for spikes in traffic. However, if there is a large spike in requests or requests are taking longer than usual, you may see 429 error codes (Too many requests).
Where can I monitor this?
Look at the Concurrency Request Utilization graph in the Feature Server Capacity Dashboard.
What should I do?
- If the concurrent request utilization is close to 100%, please follow this: Scaling capacity
Realtime Feature View Transformation
For feature services that are executing Realtime Feature views, we are executing user code at request time. Hence this depends on your code execution latency.
Where can I monitor this?
In the API response for SLO Info you can compare the difference between
sloServerTimeSeconds and serverTimeSeconds. The difference here is the time
taken by RTFV execution.
What should I do?
- Consider using
pythonmode-based Realtime feature views instead ofpandas-based mode.Since there's a fixed amount of overhead to convert records to pandas dataframes, you should only use this for larger batch sizes. - If you are transforming large amounts of data at request time from request inputs, consider materializing this data using transformations, so there is less work and transforms to be done at request time.
Debugging Client-Side Latencies
The easiest way to mitigate client side latencies is to use Tecton's client libraries:
Latency issues in the client can result from various factors, including network bottlenecks, inefficient code, misconfigurations, etc. Here are some common ones:
Network Bottlenecks and Connection Issues
Check the network connectivity and the connection quality between the client and
server. Use tools like ping, traceroute, and network monitoring
utilities to identify issues. The closer your client is to the server, the
better the latencies. Ideally, your client application runs in the same cloud
region as the Tecton deployment.
Connection Pooling
Creating a new connection for every request can lead to high overhead. Implement connection pooling to reuse existing connections and reduce connection setup overhead. Make sure to manage the pool size and connection timeouts properly.
Thread/Concurrency Issues
High latencies can occur due to excessive thread usage or improper handling of concurrent requests. Ensure that your client library manages threads and concurrency properly. Implement techniques like asynchronous programming or thread pooling to handle multiple requests efficiently.
Connection Timeouts
Requests can get stuck due to improperly configured connection timeouts. Set appropriate connection and socket timeouts to prevent requests from hanging indefinitely. Tecton uses a 2s timeout on the serving backend.
Measuring Connection Overhead
Here is a good way to measure client connection overhead:
- Create a new file,
curl-format.txt, and paste in:
     time_namelookup:  %{time_namelookup}s\n
        time_connect:  %{time_connect}s\n
     time_appconnect:  %{time_appconnect}s\n
    time_pretransfer:  %{time_pretransfer}s\n
       time_redirect:  %{time_redirect}s\n
  time_starttransfer:  %{time_starttransfer}s\n
                     ----------\n
          time_total:  %{time_total}s\n
-
Make a
curlrequest with your params to the feature serving endpoint and add the curl request field-w "@curl-format.txt". This flag tells cURL to use our format file. -
You will get back something that looks like:
   namelookup:  0.006374s
      connect:  0.008735s
   appconnect:  0.046435s
  pretransfer:  0.046496s
     redirect:  0.000000s
starttransfer:  0.057261s
-------------------------
        total:  0.057327s
This breakdown gives you insights into how much time each stage of the process took, allowing you to understand the performance of the network request.
If you are spending majority of your time in connect and appconnect you're
paying the per connection creation and authentication overhead. Using a
connection pool will help a lot here.
connect: This stage represents the time it took to establish a connection to the server after the DNS lookup. This can involve negotiating the connection parameters and ensuring both the client and server can communicate. Here, it took 0.008735 seconds to establish the connection.
appconnect: This stage involves the time taken to establish an SSL/TLS (Secure Sockets Layer/Transport Layer Security) connection. SSL/TLS is used to encrypt the data transmitted between the client and the server for security purposes.
Feature Serving Errors
When your system is experiencing high latencies or is under-provisioned (due to the above-listed situations), you can get the following two error codes:
- 504 [Timeout] - This error indicates that processing the request exceeded the 2 seconds timeout limit set by Tecton because either the Online Store did not respond or Tecton could not process the response within the time limit.
- 429 [Resources Exhausted] - This error indicates that you have exceeded the concurrent request limit for your deployment. This can be due to:
💡 In some cases, high latencies can cause 429s. This is because Tecton's serving infrastructure is bound by the number of concurrent online queries it can execute at a given point in time. Since concurrency being utilized is essentially Total QPS x Avg Query time, if there is a sudden spike in latencies, there is less capacity available for incoming queries and they will get 429 errors.