Optimize Spark Materialization Clusters
Optimizing Backfills
By default, Tecton attempts to optimize the number of backfill jobs computed for each feature view. For large backfill jobs however, this default logic may not always be sufficient.
You can configure the number of days worth of data that is backfilled per job
using the max_backfill_interval parameter on feature views. This can help
reduce the amount of spark resources needed.
The example below sets max_backfill_interval to 15 days and if applied, will
start (today - feature_start_time)/15 backfill jobs.
@batch_feature_view(
    sources=[transactions_batch],
    entities=[user],
    mode="spark_sql",
    online=True,
    offline=True,
    feature_start_time=datetime(2022, 5, 1),
    max_backfill_interval=timedelta(days=15),
    batch_schedule=timedelta(days=1),
    ttl=timedelta(days=30),
    description="Last user transaction amount (batch calculated)",
    timestamp_field="timestamp",
    features=[Attribute("amt", Float64)],
)
def last_transaction_amount(transactions_batch):
    return f"""
        SELECT
            timestamp,
            user_id,
            amt
        FROM
            {transactions_batch}
     """
Streaming cluster configuration
Costs can add up quickly for streaming features because the Spark cluster is always running. If you have many streaming features, setting these options correctly will have the largest impact on your compute usage with Tecton.
If stream_cluster_config is not set, then Tecton will use a default instance
type and number of workers. You will likely want to adjust this default to fit
your production workload. Either the cluster will be under-provisioned and lead
to delayed features, or be over-provisioned and cause unnecessary costs.
How to tell if your stream cluster is over-provisioned
In short, we want to understand if the Spark cluster used for the stream processing job has excess compute or memory.
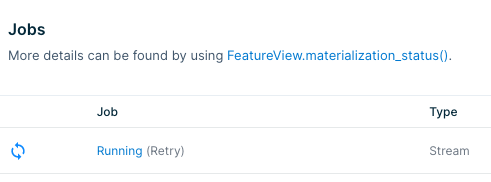
You can find the stream job associated with a feature by clicking on the Running link in the Job column in the materialization tab for the feature. This will link you to job info with your Spark provider.
From there you can find the Ganglia metrics for compute or memory usage. If the
charts show that the resources are way underutilized (e.g. CPU is 98% idle),
then you can safely reduce costs by specifying the number of workers or instance
types for your stream_cluster_config.
Batch cluster configuration
Batch processing doesn't have as much room for cost optimization as stream processing because the clusters terminate as soon as the job is done. Decreasing cluster resources may cause the jobs to take longer and offset any cost savings.
That said, you can still inspect the job logs through the link in the materialization tab shown above. If your jobs are finishing very quickly (say, less than 15 minutes), you may be spending an unnecessary amount of time spinning up the cluster and could benefit from reducing the number of workers.