Data Quality Metrics
This feature is currently in Public Preview.
- Available for Tecton on Databricks and EMR. Coming to Tecton on Snowflake in a future release.
- Available for Batch and Stream Feature Views.
Data Quality Metrics help detect feature data issues quickly by providing summary statistics about the data produced by your Feature View pipelines. These metrics enable you to validate that your feature pipelines are writing the expected values into your feature store.
Enabling the Data Quality Metrics Preview
Contact Tecton Support to enable the Data Quality Metrics collection for your
Tecton instance. Once enabled, Tecton will begin to collect summary statistics
during future batch materialization jobs for all the supported Feature Views.
Metrics collection can be manually disabled by Feature View by setting
data_quality_enabled=False in a Feature View declaration.
For Feature Views created prior to when Data Quality Metrics were enabled for your instance, metrics will only be available for materialization jobs that ran after the rollout.
In rare cases, metric collection can negatively impact job performance. Contact Tecton Support if you notice materialization jobs are running slower or failing after Data Quality Metrics are enabled.
Using the Data Quality Metrics tab
Navigate to the Features section and select a Feature View with materialization
enabled. If Data Quality Metrics is enabled for your environment, you will see
the Data Quality Metrics tab. To show metrics, a BatchFeatureView must have
offline=True or online=True set, and a StreamFeatureView must have
offline=True set.
For Stream Feature Views, metrics are only calculated for features materialized to the offline store by batch jobs. Features produced by stream jobs are not included in the results.
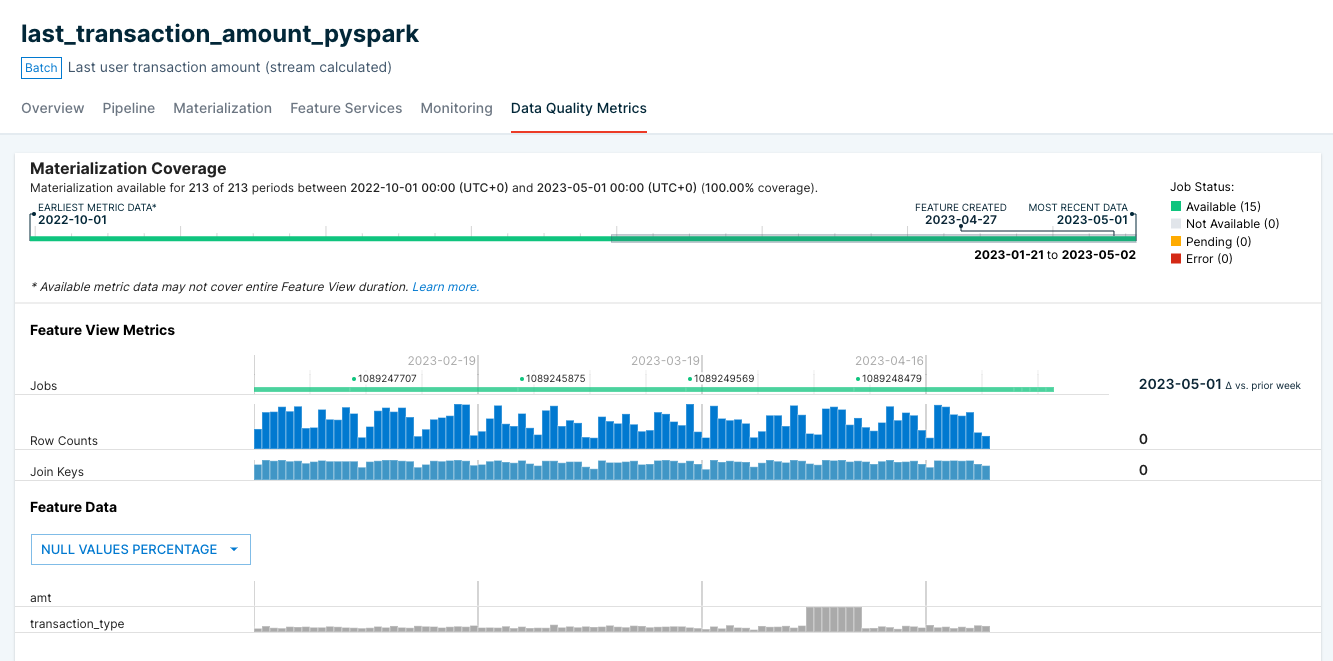
At the top of the Data Quality Metrics tab, you can use the Materialization Coverage scroll bar to adjust the displayed date range. The Materialization Coverage scroll bar also shows the availability of metrics:
- Available: metrics for that time period have been computed.
- Not Available: the jobs for that period have already run, but metrics are not available. For example, the job may have run before Data Quality Metrics were enabled.
- Pending: the job for that time period has not yet completed, and metrics will
be available after it is complete. If using
batch_trigger=BatchTriggerType.MANUAL, then the time period will show pending until a job is triggered for that interval. - Error: the job for that period had an error and could not complete, so no metrics are available.
The Feature View Metrics section contains information that applies to the Feature View:
- Jobs: the Job ID that produced the data for the schedule interval. Clicking on the Job ID will take you to the job details in your data platform.
- Row Counts: The count of rows output for the schedule interval. For Feature Views with aggregation, Row Counts are the count of rows before aggregation.
- Estimated Join Keys: The number of unique join keys output for the schedule interval. The number of unique join keys output for the schedule interval. Join keys are calculated using an approximate count distinct algorithm and may have some error, typically less than 5%. If Estimated Join Keys and Rows Count values are close, your Feature View likely outputs a single row per unique join key.
The Feature Data section contains metrics about individual features in the Feature View. Use the drop-down to change which metric is displayed below.
The available metrics are:
- Null Values Percentage: the percentage of rows that had null values per materialization interval, relative to the total number of materialized rows. Available for all feature types.
- Zero Values Percentage: the percentage of rows that had a numeric value equal to zero (Numeric features), or lengths equal to zero (String or Array features), relative to the total number of materialized rows.
Hover over a specific interval for a feature to see the exact metric values.
Additionally, Tecton will display the change compared to a prior time period.
For example, the change vs. prior week compares the current value to the
average of the prior week.