Production SLOs
This page details the Service Level Objective (SLO) for the Feature Server that Tecton commits to upholding. The SLO covers both Reliability and Latency, based on Service Level Indicators (SLIs) described below. The indicators are determined by Tecton on the server side, and compliance with the SLO is evaluated on a 30 day rolling period.
Reliability
The SLI for reliability is the percentage of requests which do not return a server error (HTTP 5xx). For the purpose of this indicator, client errors (HTTP 4xx) are not considered errors. Additionally, requests which time out on the server side and return 504 do not count against the reliability SLI unless they are SLO-Eligible according to the definition in the Latency section.
The objective for this indicator is 99.95%.
Latency
The SLI for latency is the percentage of SLO-Eligible requests which complete in 100 ms or less. The objective for this indicator is 99%.
An SLO-Eligible request is a request which:
- Does not require processing more than 2MiB of items returned from the Online Store.
- Reads from Redis take less than 25 ms if using Redis as the Online Store.
For feature services with on demand feature views, Tecton provides SLO on feature serving time minus the On Demand Feature View execution time. Typically On Demand Feature Views incur minimal latency for your requests, but since they contain arbitrary user code we cannot include the On Demand Feature View execution time for SLO.
SLO Indicators
Web UI
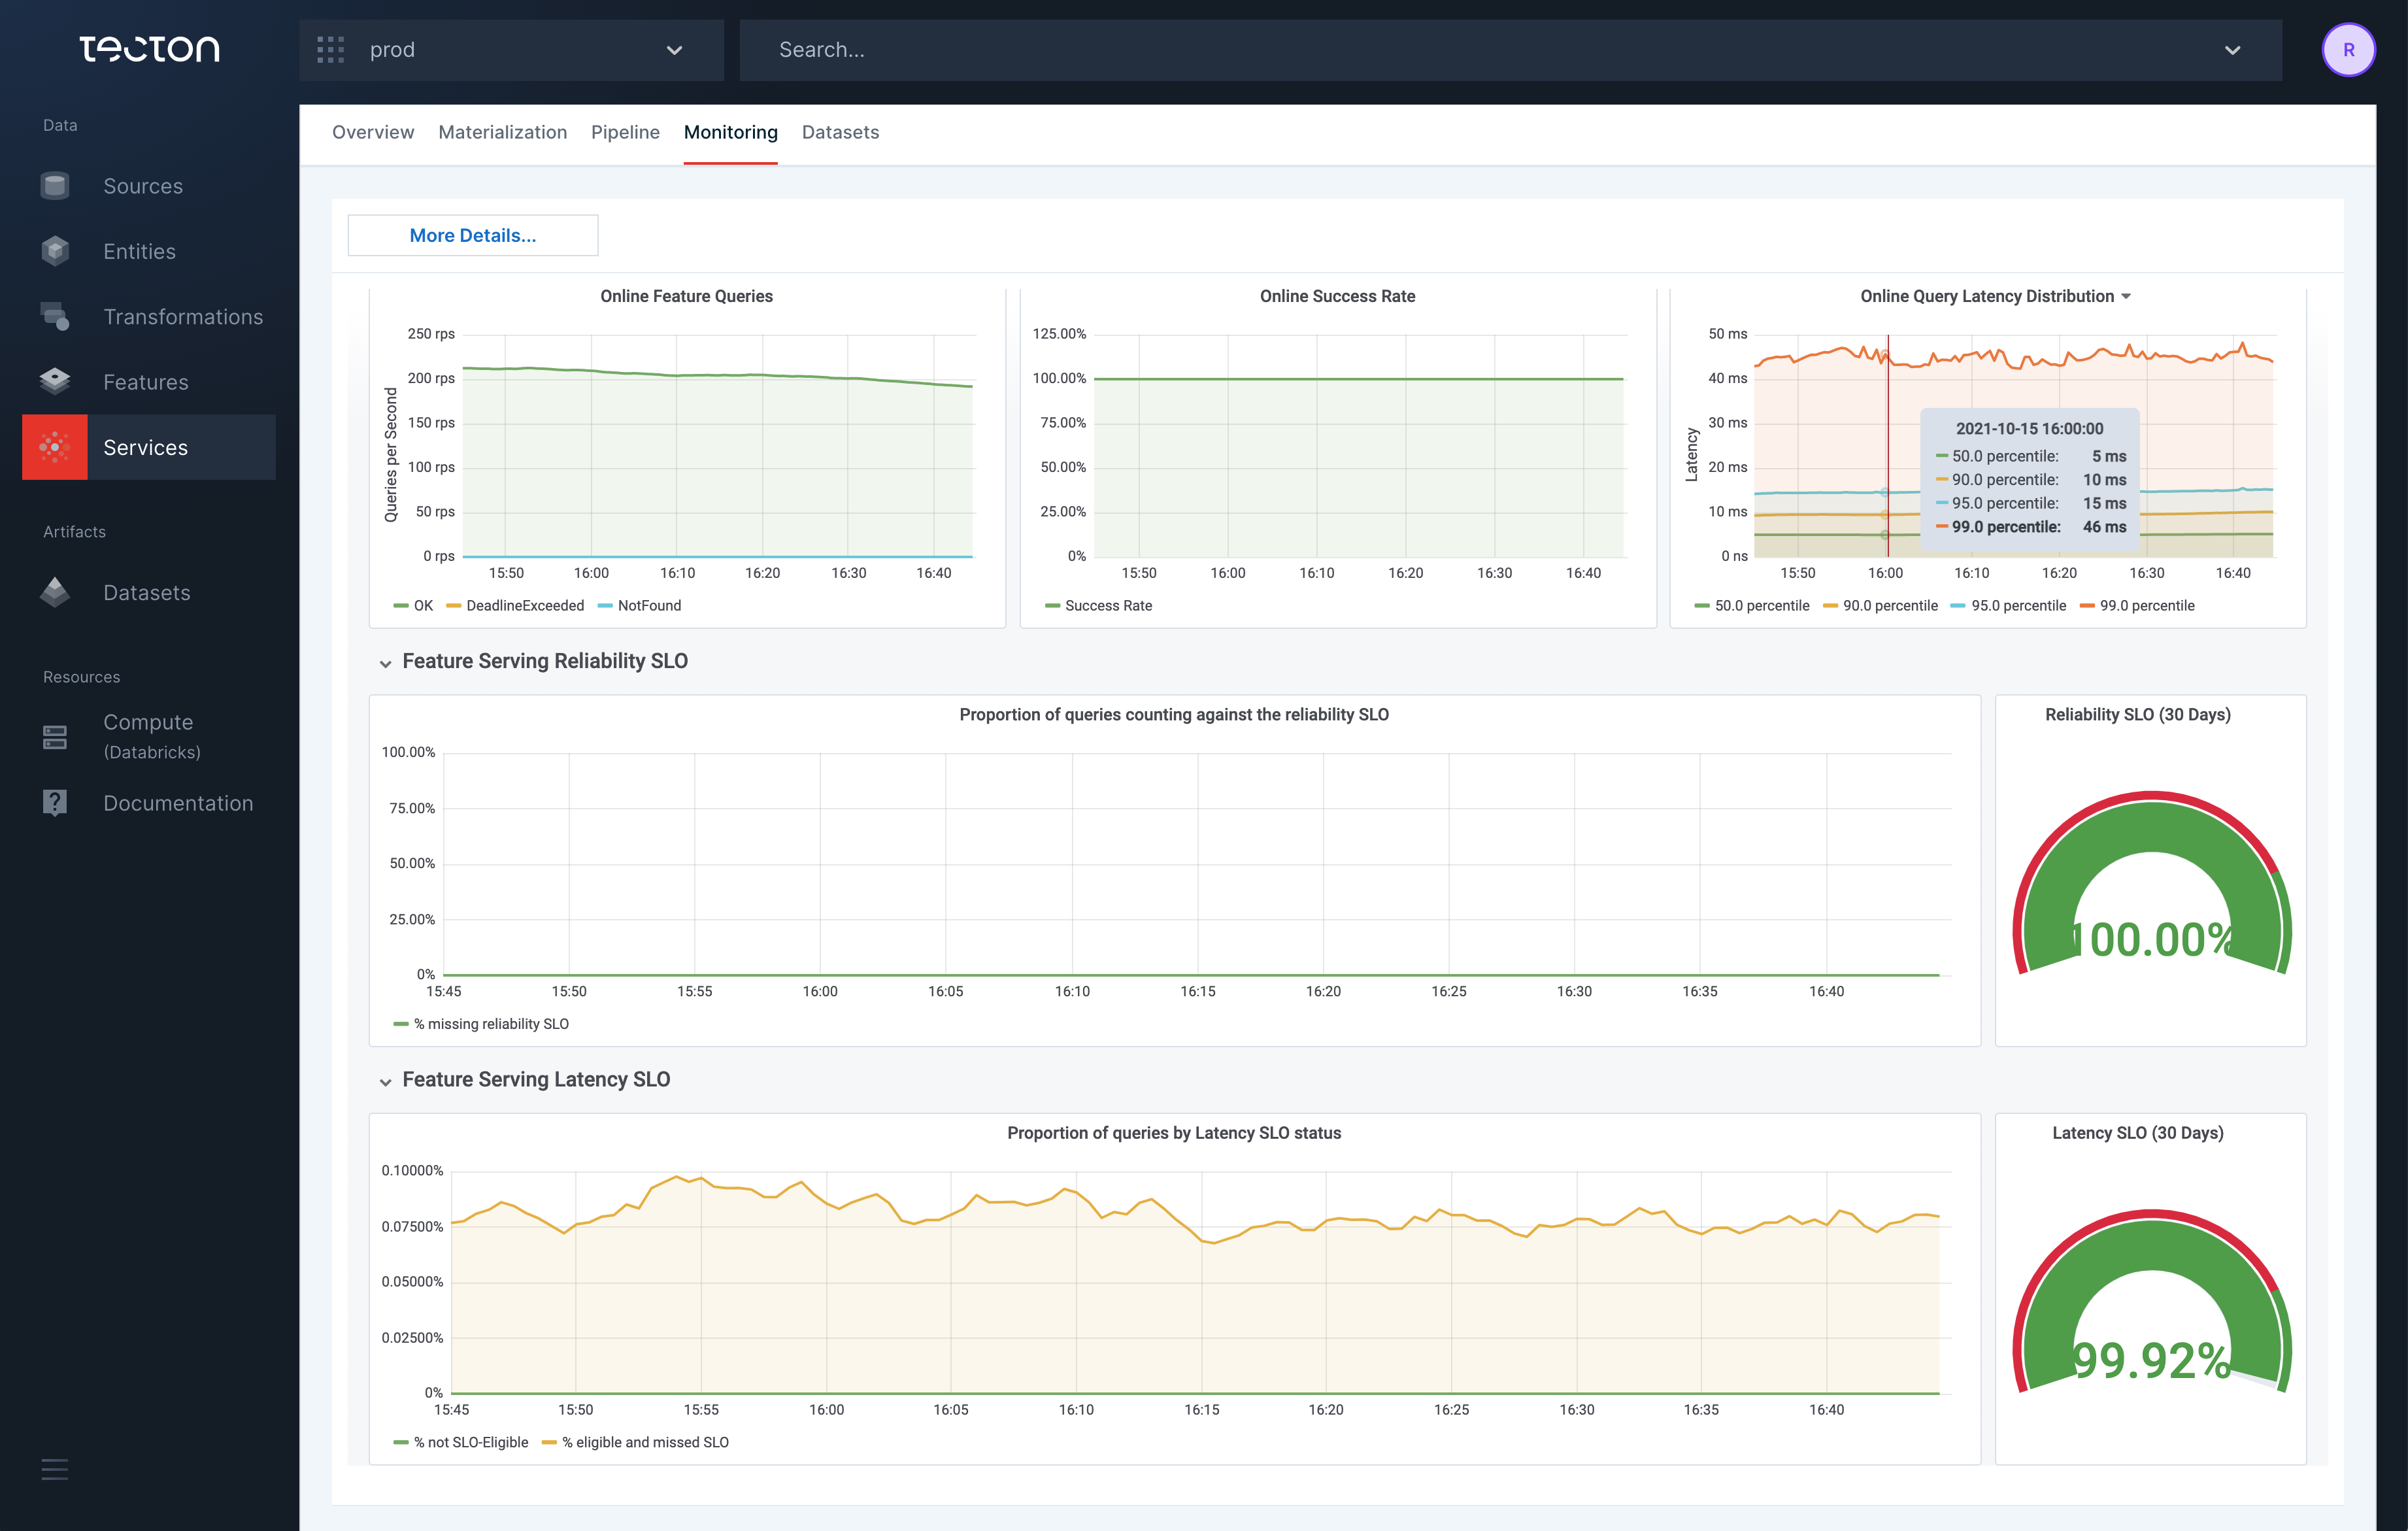
Monitoring for both the latency and reliability SLOs are available in the Web UI under the monitoring tab for each Feature Service. In addition to the rate of SLO violations, the rate of requests to the service which are not SLO-Eligible is shown.
Feature Service Metadata
SLO information can optionally be returned in Feature Service responses. To
enable returning the SLO information, set the includeSloInfo field in the
metadataOptions of a get-features or query-features request body:
{
  "params": {
    ...
    "metadataOptions": {
      "include_slo_info": true
    }
  }
}
The response metadata will then contain an sloInfo object with information
about that request, e.g.:
{
    "metadata": {
        'sloInfo": {
            "dynamodbResponseSizeBytes": 13100000,
            'serverTimeSeconds": 0.034437937,
            'sloEligible": false,
            'sloIneligibilityReasons": [
                "DYNAMODB_RESPONSE_SIZE_LIMIT_EXCEEDED"
            ]
        }
    }
}
sloInfo contains the following fields:
sloEligible: Indicates whether the request was eligible for the latency SLO.sloServerTimeSeconds: The latency, in seconds of this request. This is the value that will be used for the latency SLI.sloIneligibilityReasons: Only present ifsloEligibleisfalse. In this case it will be a list of one or more strings indicating reasons why the request was not SLO-Eligible. Possible values are:DYNAMODB_RESPONSE_SIZE_LIMIT_EXCEEDED: The 2MiB limit for DynamoDB response size was exceeded.
dynamodbResponseSizeBytes: The total DynamoDB response size processed to serve this request, in bytes. If this is greater than 2 MiB (i.e. 2097152), then the request is not SLO-Eligible.serverTimeSeconds: The latency, in seconds, of this request as measured by the server.
SLO Violations
If an SLO violation is detected by Tecton, a Tecton on-call engineer will be immediately alerted to respond to the situation within 1 hour, 24/7.
If a customer detects what appears to be an SLO violation which is not reflected in the SLO indicator in the Web UI (e.g. latency seems to be high from the client-side, but the Tecton Latency SLI is still in compliance), a Tecton engineer will respond to service requests within 8 hours, during business hours.